Our State of the Collection Report is an in-depth and personalized reporting feature provided to Basecamp and Summit Edelweiss+ Analytics libraries. (Details of the various subscription levels can be found here.)
This report will provide you with an objective assessment of the strengths and weaknesses of your library’s collections, identify specific areas to focus on, and enable you to track improvement over time. The audience for this report is just you and your library– no one else sees this information.
The report can be accessed by adding it as a widget on your homepage. When the new report is run, it will arrive as a link to an interactive app that you can, if you wish, print as a PDF. You’ll be able to view previous reports, manage your recipients, and more.
The idea behind the State of the Collection Report is to provide a comprehensive look at your collection from the macro, market level all the way down to pinpointing individual titles. Since we’re comparing collection performance across the market place, this report uses industry-wide genre specifications, which are added to each title by the publishers. While each library system has their own unique collection codes, the book industry itself has a more consistent and universal classification system. Segmenting by industry genre allows us to set realistic benchmarks for you to focus on, rather than comparing the performance of a genre like Art / Architecture to Comics & Graphic Novels, which is generally the more traditional approach… simply because no other tool really exists to see these market-wide performance benchmarks. You don’t have to do anything on your end to send us genre classification data.
This report measures your book collection only.
Each category is ‘graded’ according to 4 different measurements:
- Freshness: Using the Edelweiss+ Analytics Shelf Days analysis, an overall measure of the % of your own collections that is circulating well, or not.
- Relevance: Do you own the titles that are selling or circulating well everywhere else?
- Hit Rate: Measuring the effectiveness of your collection development, this measure shows whether or not newly published titles that you stocked were ever checked out.
- Turnover: How many times per year the average title circulated, a good overall measure for how well your collection performs, so to speak.
We have identified and implemented these four measures that, together, represent a solid approximation of a very healthy collection. Basically, managing towards the optimization of these four measures helps lead to a healthy collection, and a healthy collection makes a happy community.
Helpfully, the State of the Collection Report’s format allows you to track performance over time and provides a consistent way to communicate goals, issues, and victories with board members and directors, as well as staff members.
Navigating the State of the Collection Report
Navigating around the Stat of the Collection Report is pretty simple, but we’ll call out a few helpful tools for you:
The bottom right of each page provides a way to advance to the next or previous page:
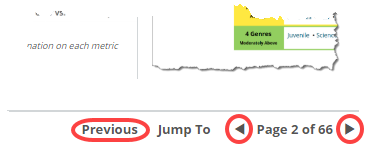
The arrow keys on your keyboard will advance you through these pages as well.
*Note that you can zoom in using <CTRL><+> (on your keyboard) and zoom out by hitting <CTRL> <->.
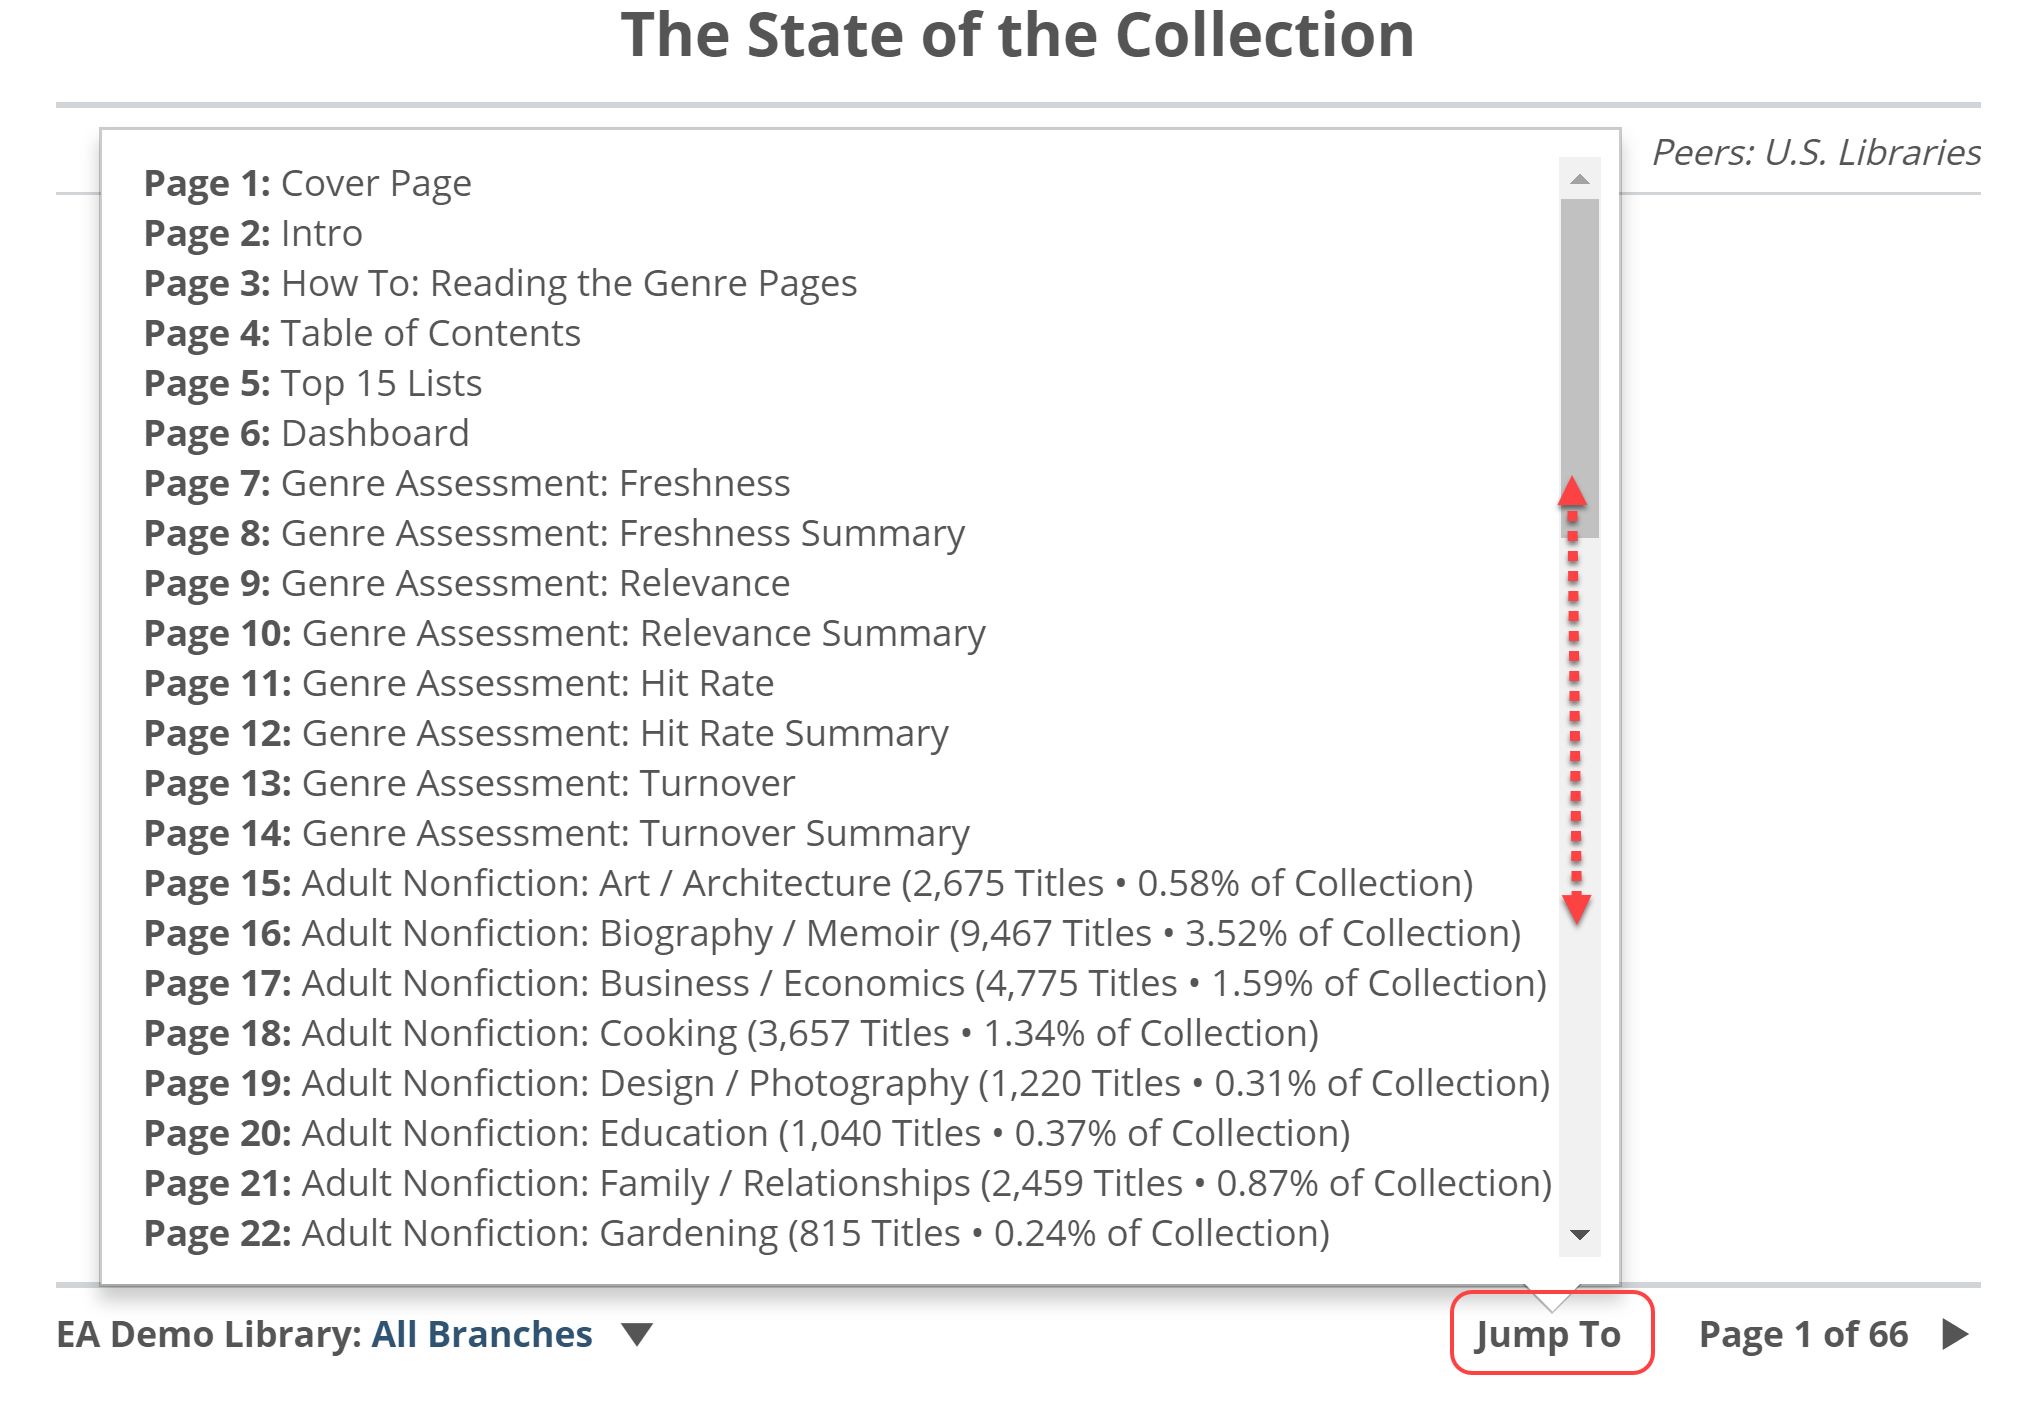
Most helpfully, the Jump To allows you to immediately click through to any page in the report:
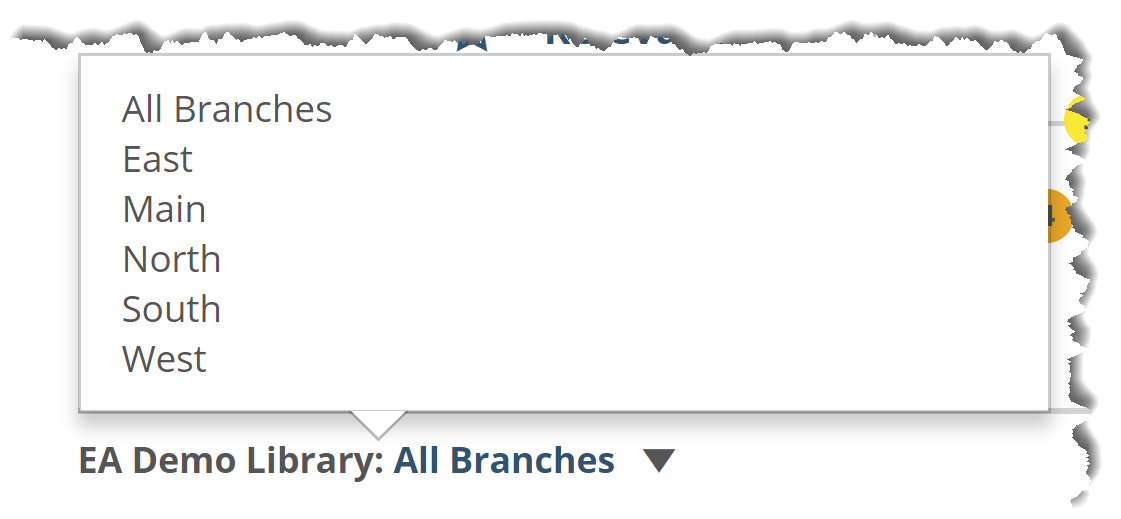
If you have multiple branches for which we receive data, you can switch between them in the lower left:
The State of the Collection Report starts out at the highest level, assigning average ‘scores’ for each of the 4 Shelf Report measurements to your entire book collection. As you progress through the report, you’ll dive deeper and deeper in to specific genres and will be able to dive on down to the title-level. Basically, you can see a problem area in a specific category and see which specific titles are either causing the issue, or which could help to fix the issue, as the case may be. Simply click in to a graph to see the titles in it.

Cover Page, Top 15 Lists, and Dashboard
The first few pages of your State of the Collection Report give a quick high-level overview.
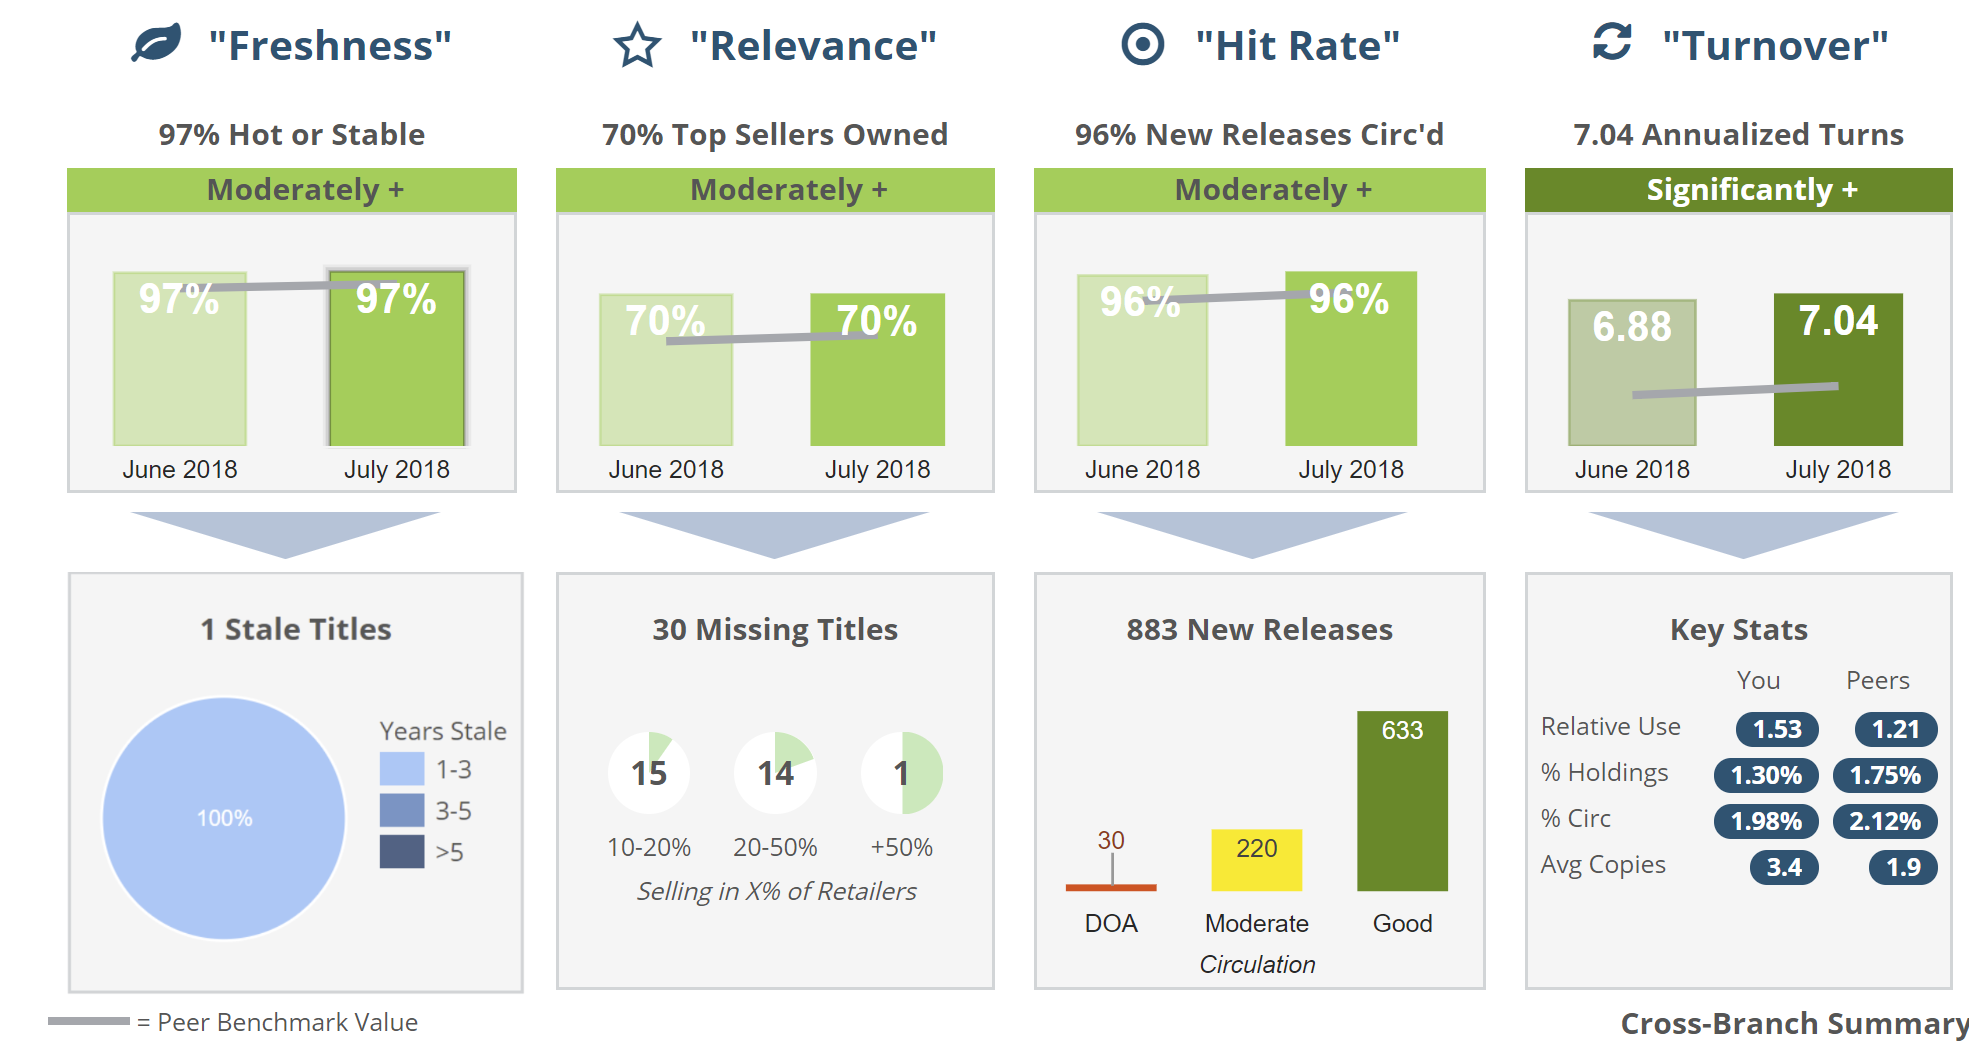
The Cover Page shows a quick, basic view of the 4 Shelf Report Measures, their current score, and any change since your last report for your entire collection (books only):
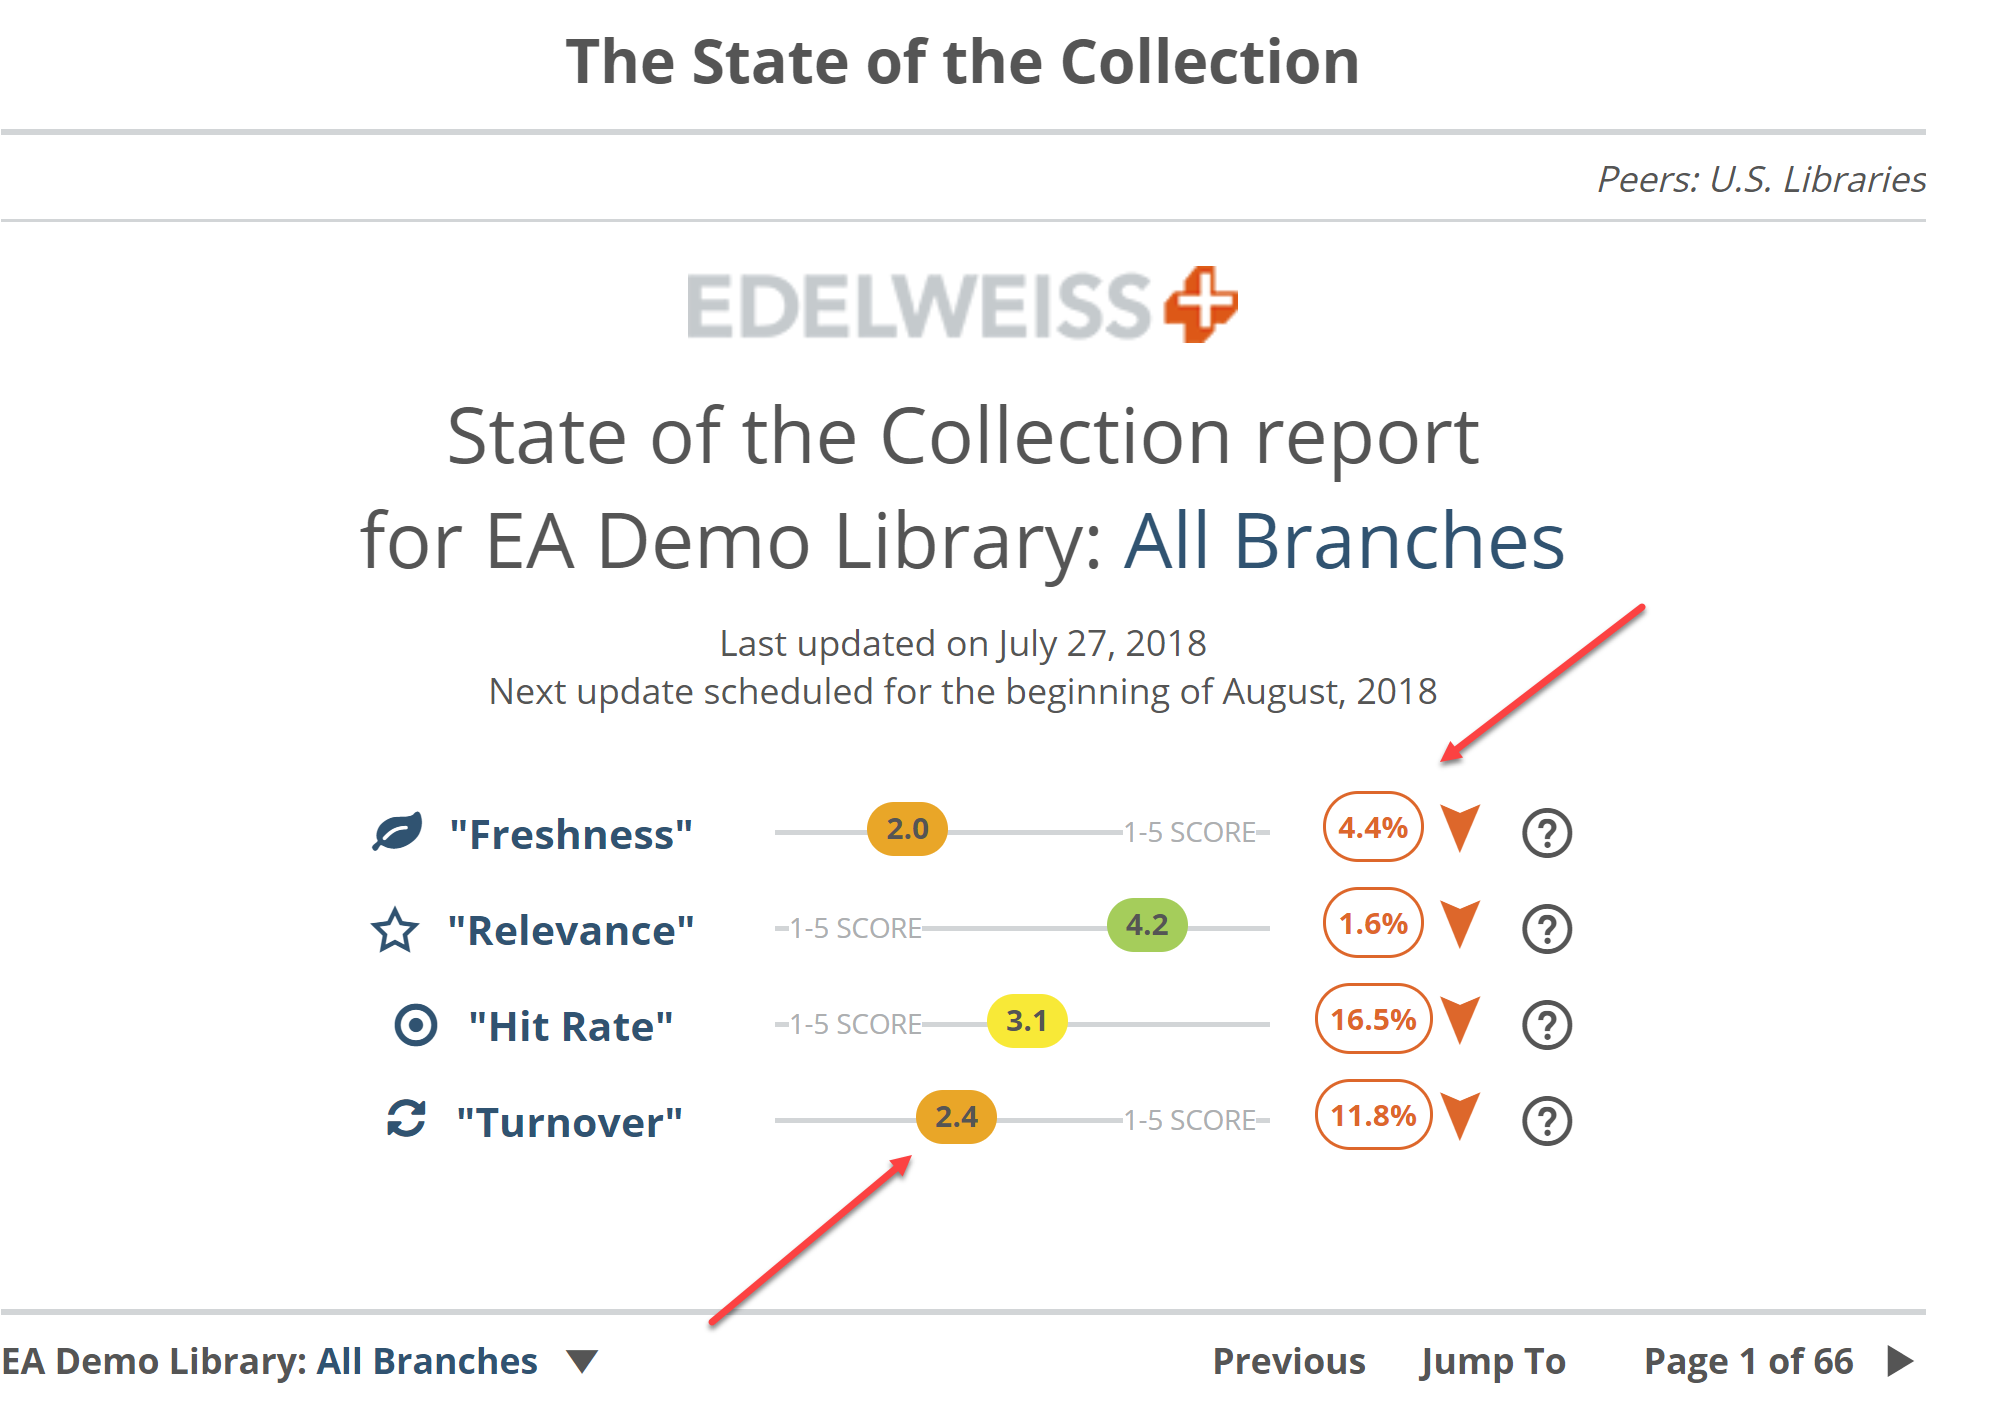
In the case shown above, this library’s Freshness score has dropped 4.4% since the last report, and the Turnover score has jumped a whopping 11.8%.
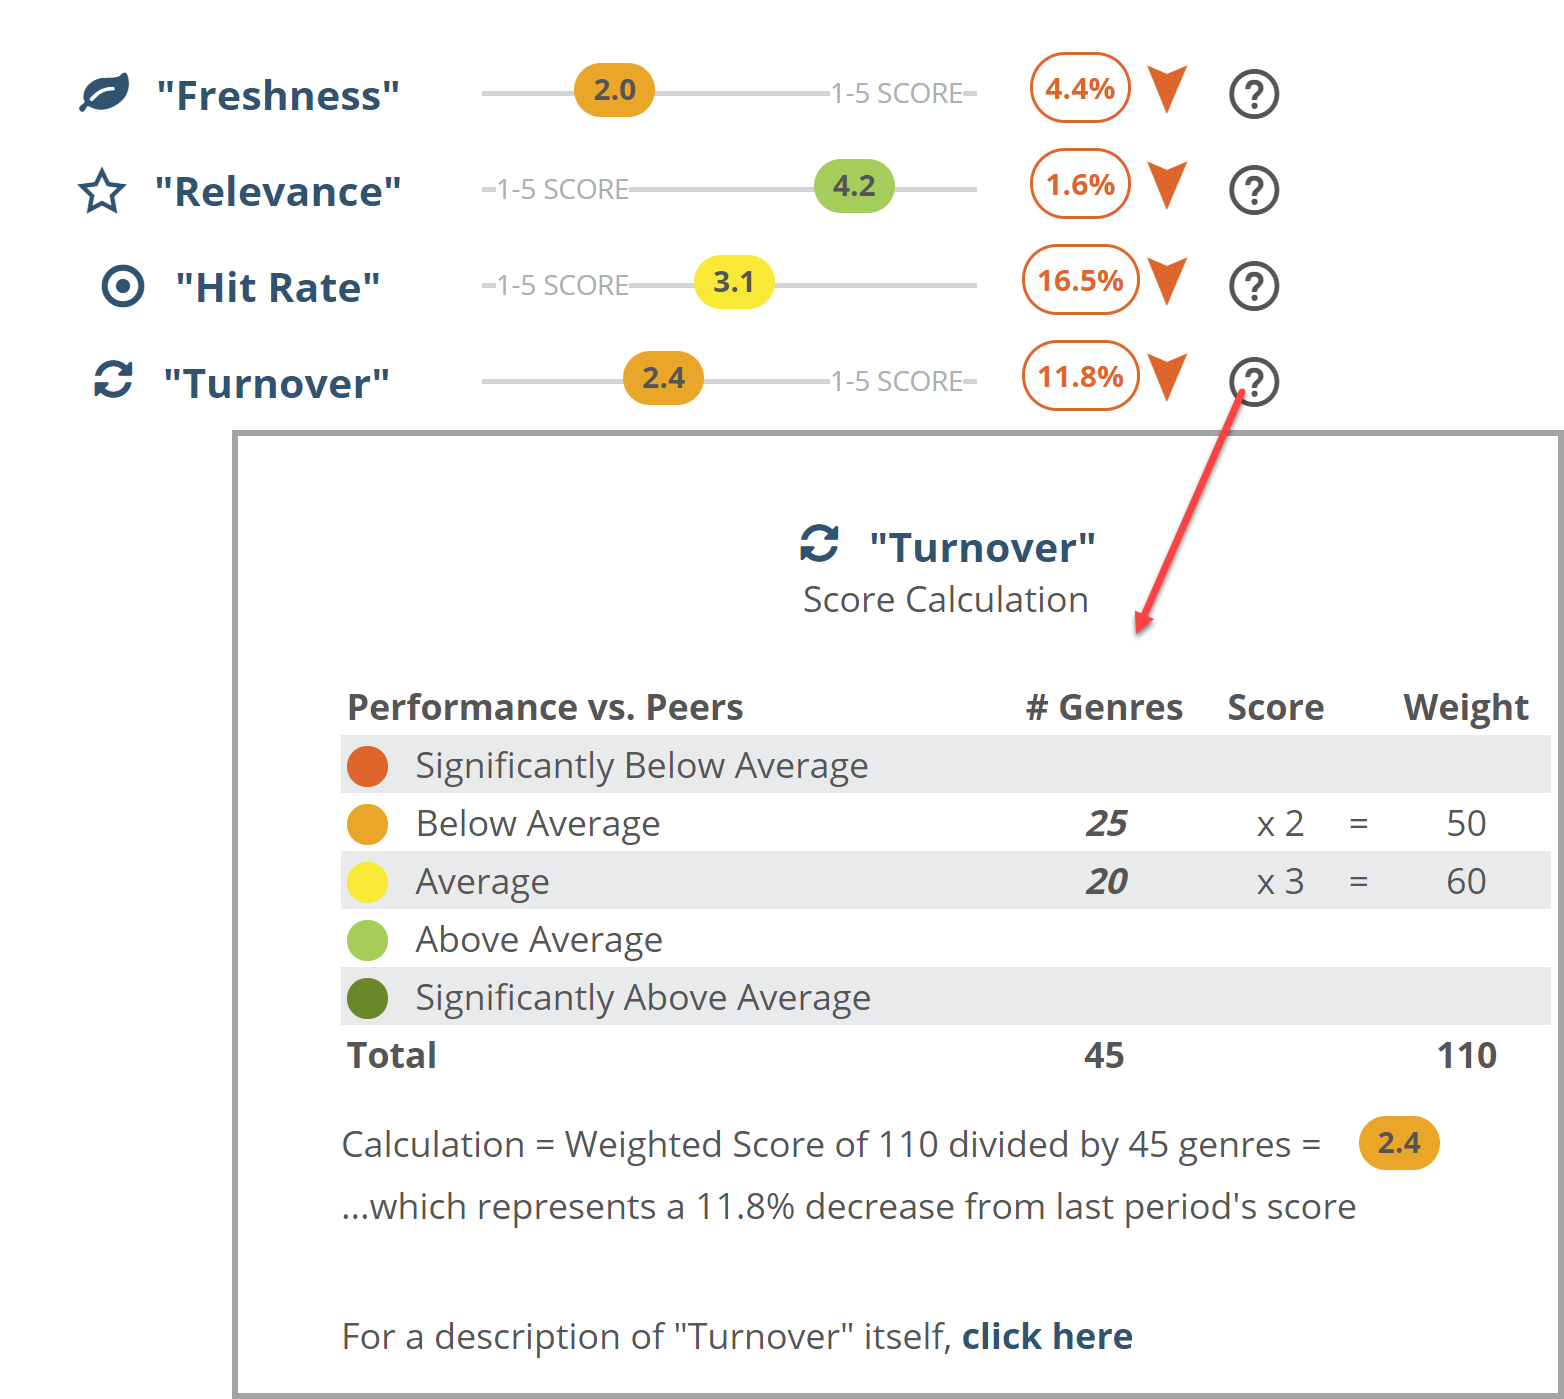
Click the ? icon next to each measure to see details about how that score was calculated:
Top 15 Lists:
Of the 44 genre classifications listed in the State of the Collection Report, this page will show you your 15 top-performing, and the 15 worst-performing categories, based on the 4 measures found throughout the report.
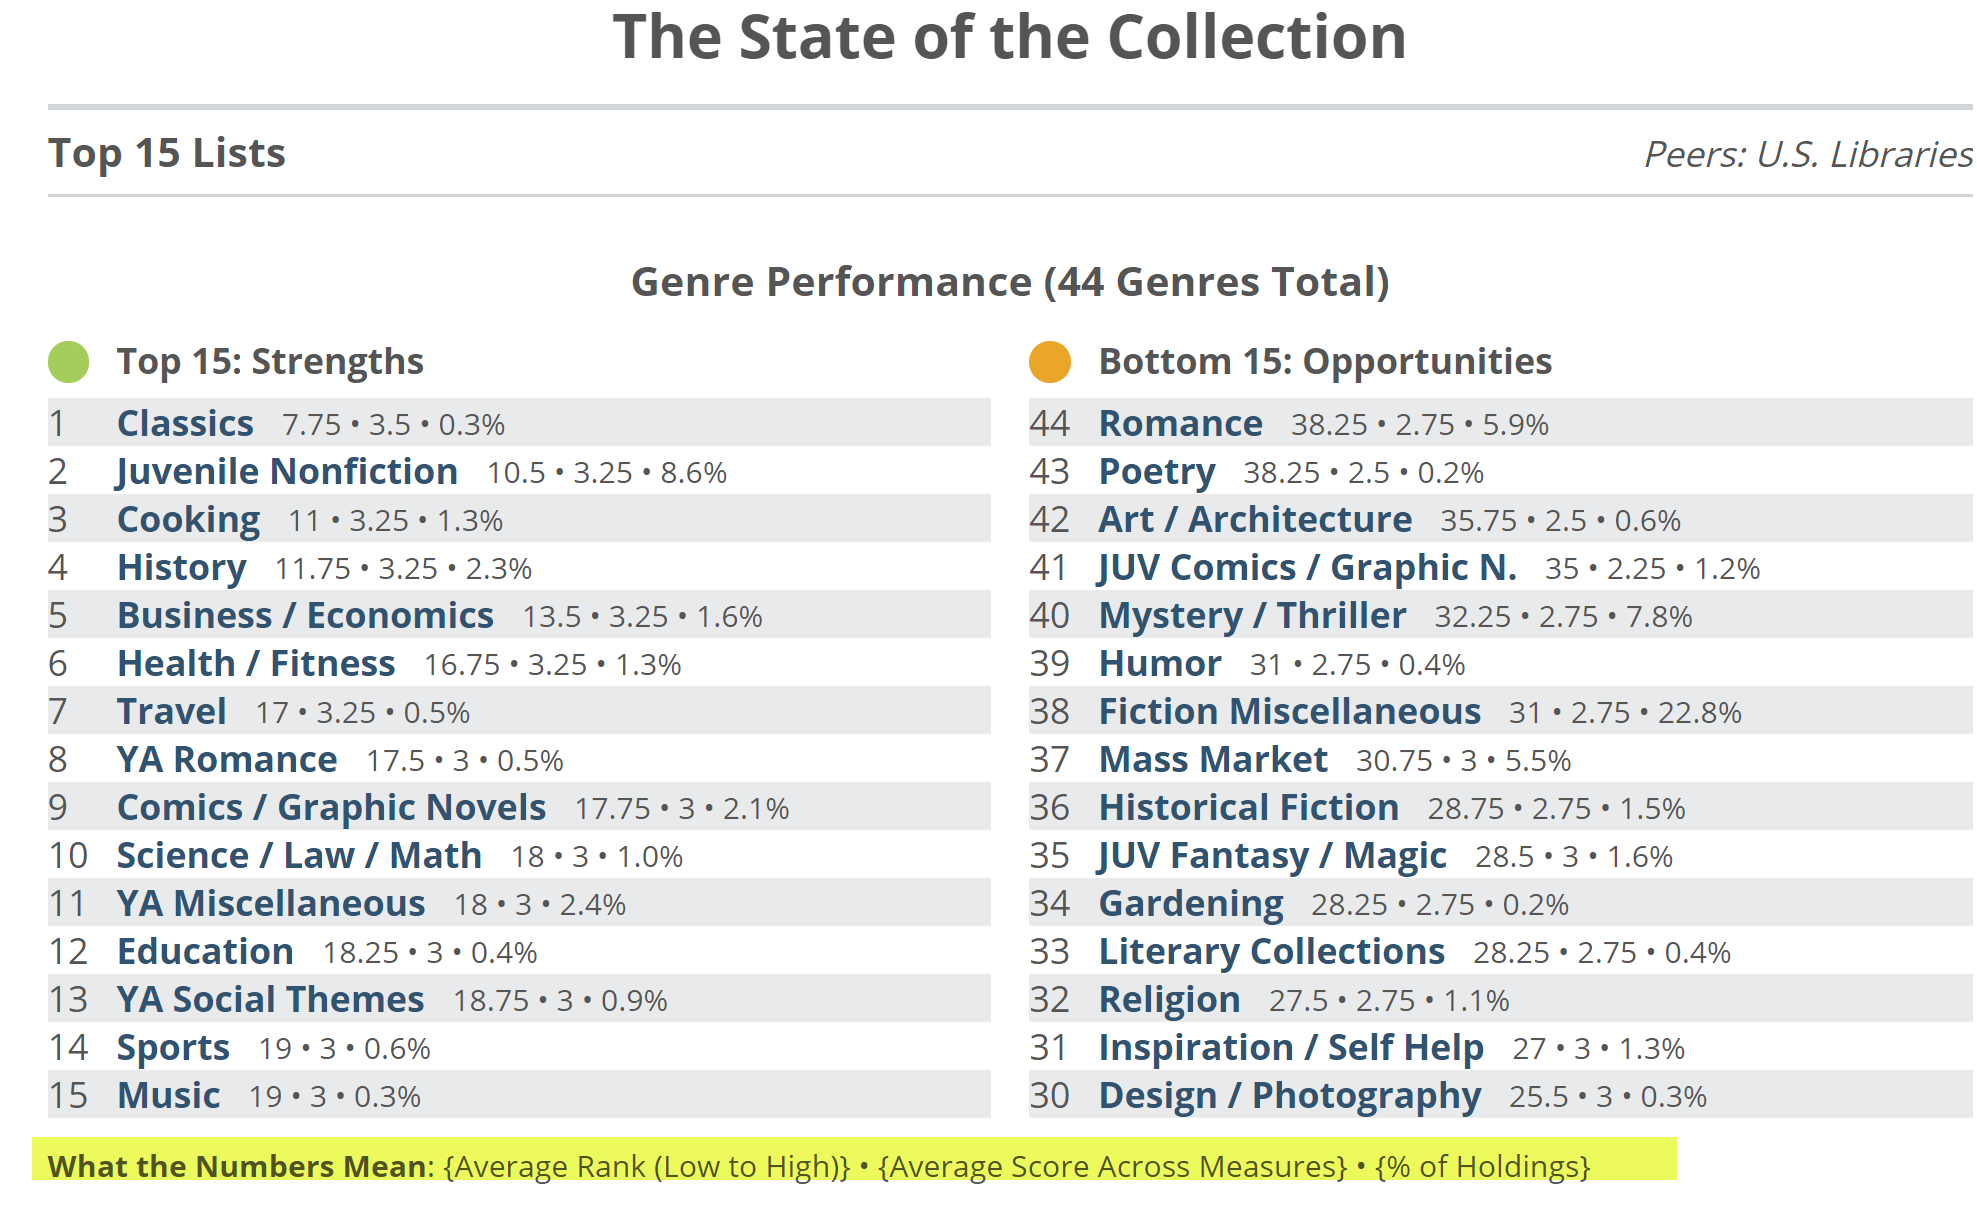
Click on a category/genre to see its Genre Detail page.
Dashboard:
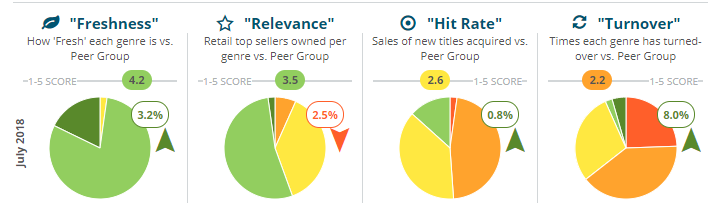
The Dashboard page shows a pie graph for each of the 4 Shelf Report measures, indicating how all the various genres perform within that specific measure.
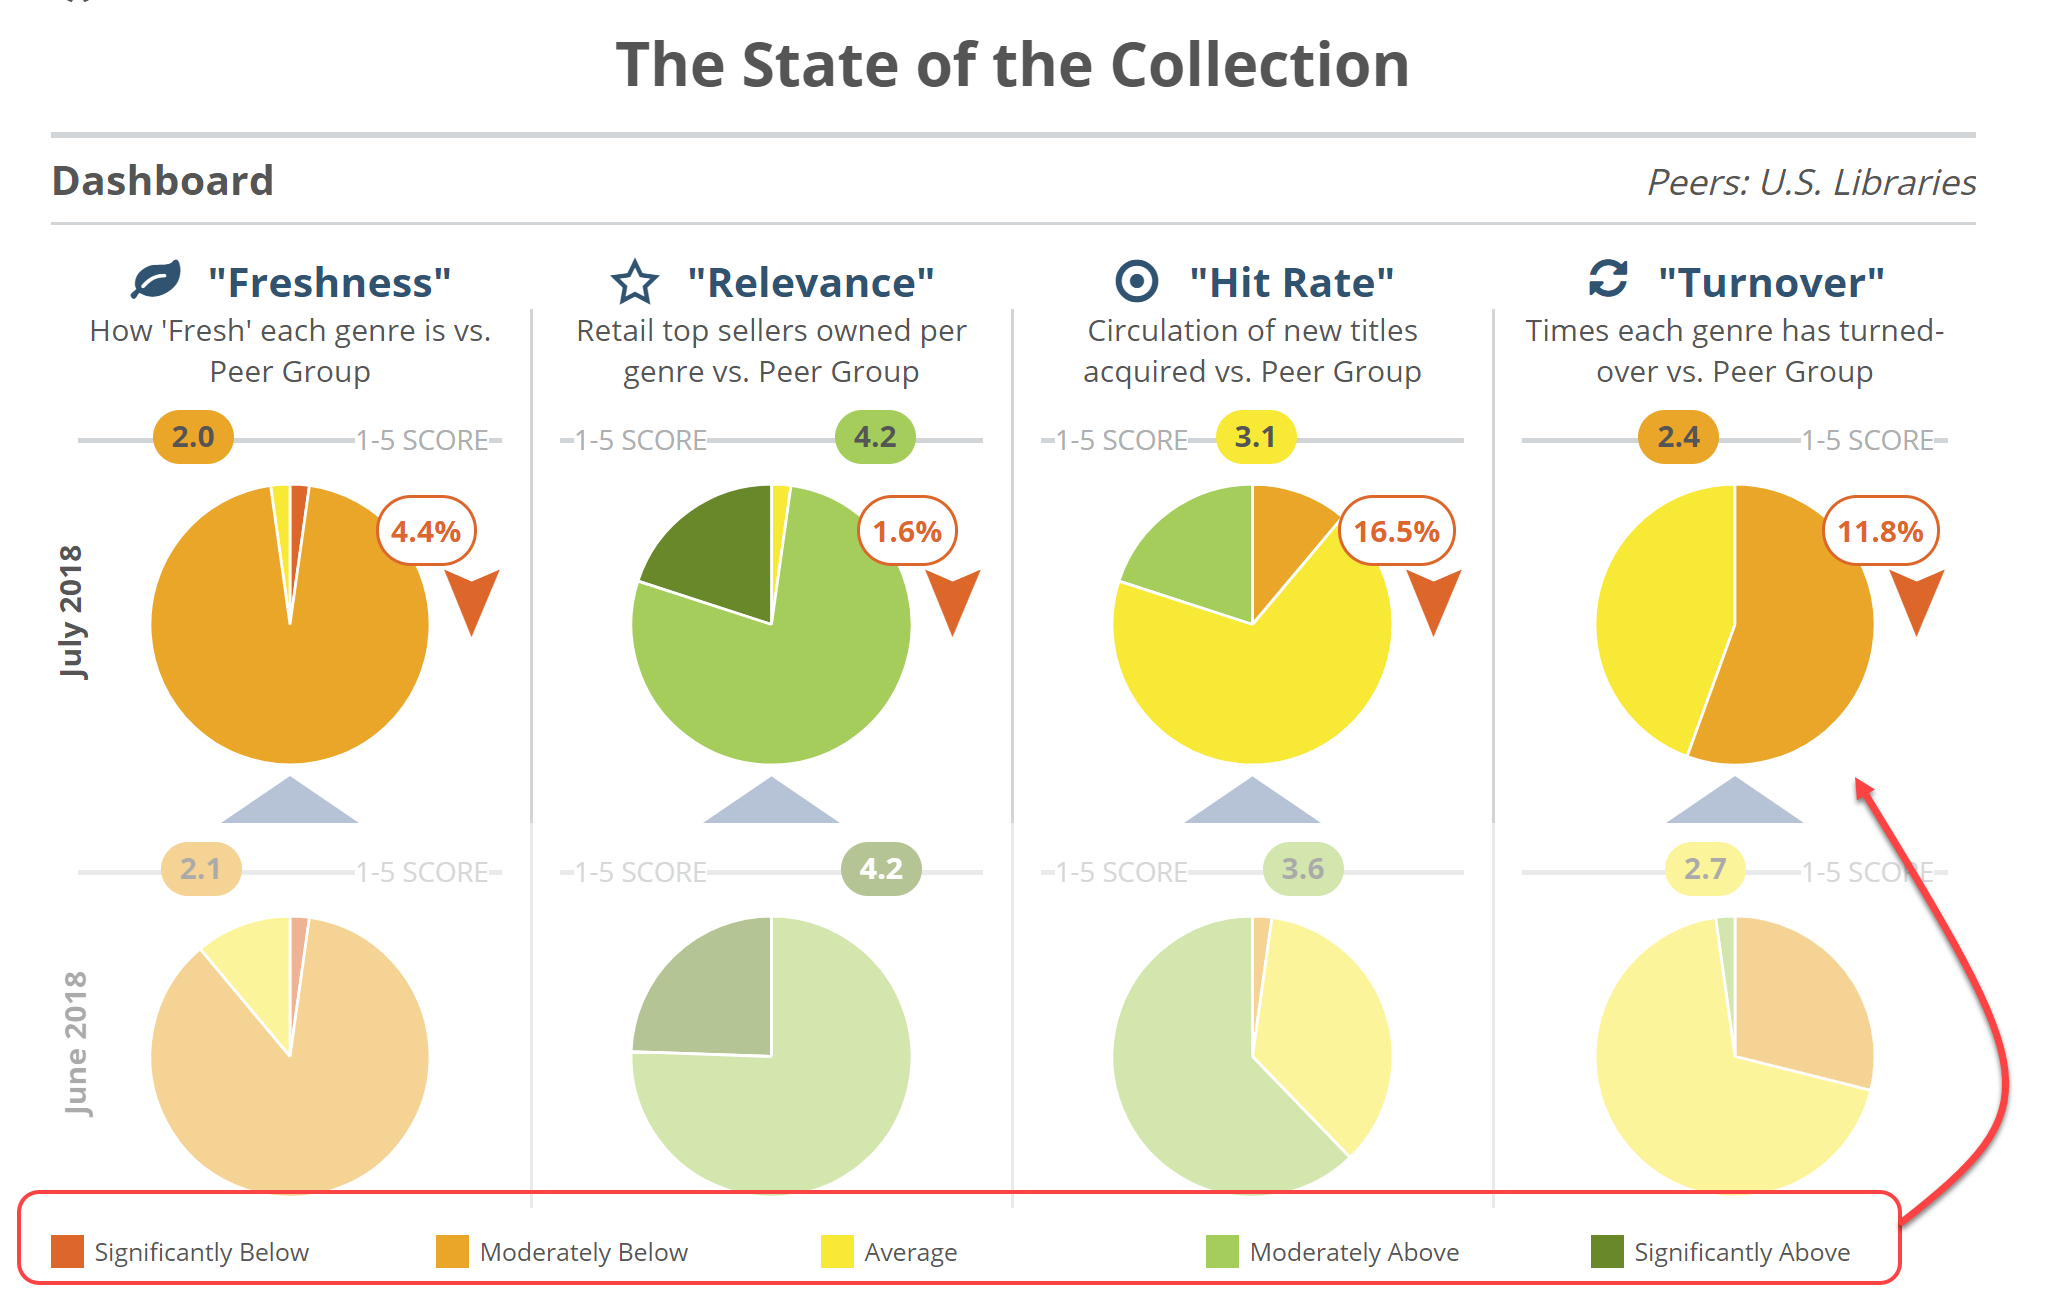
In the image above, you can see that for the Turnover graph, most genres at this library have turns that are “Moderately Below” of “Significantly Below” average. Click on a graph to see how each specific genre is performing, in the Genre Assessment pages:
Note that the gray dots indicate the market average for that genre, while the numbers in parenthesis under Share indicate the percentage of inventory the average library dedicates to that genre. So you can get an overall view of your collection, click through to get a more granular view, and then advance to the next pages to dive in ever deeper.
Reading the Genre Assessment Pages
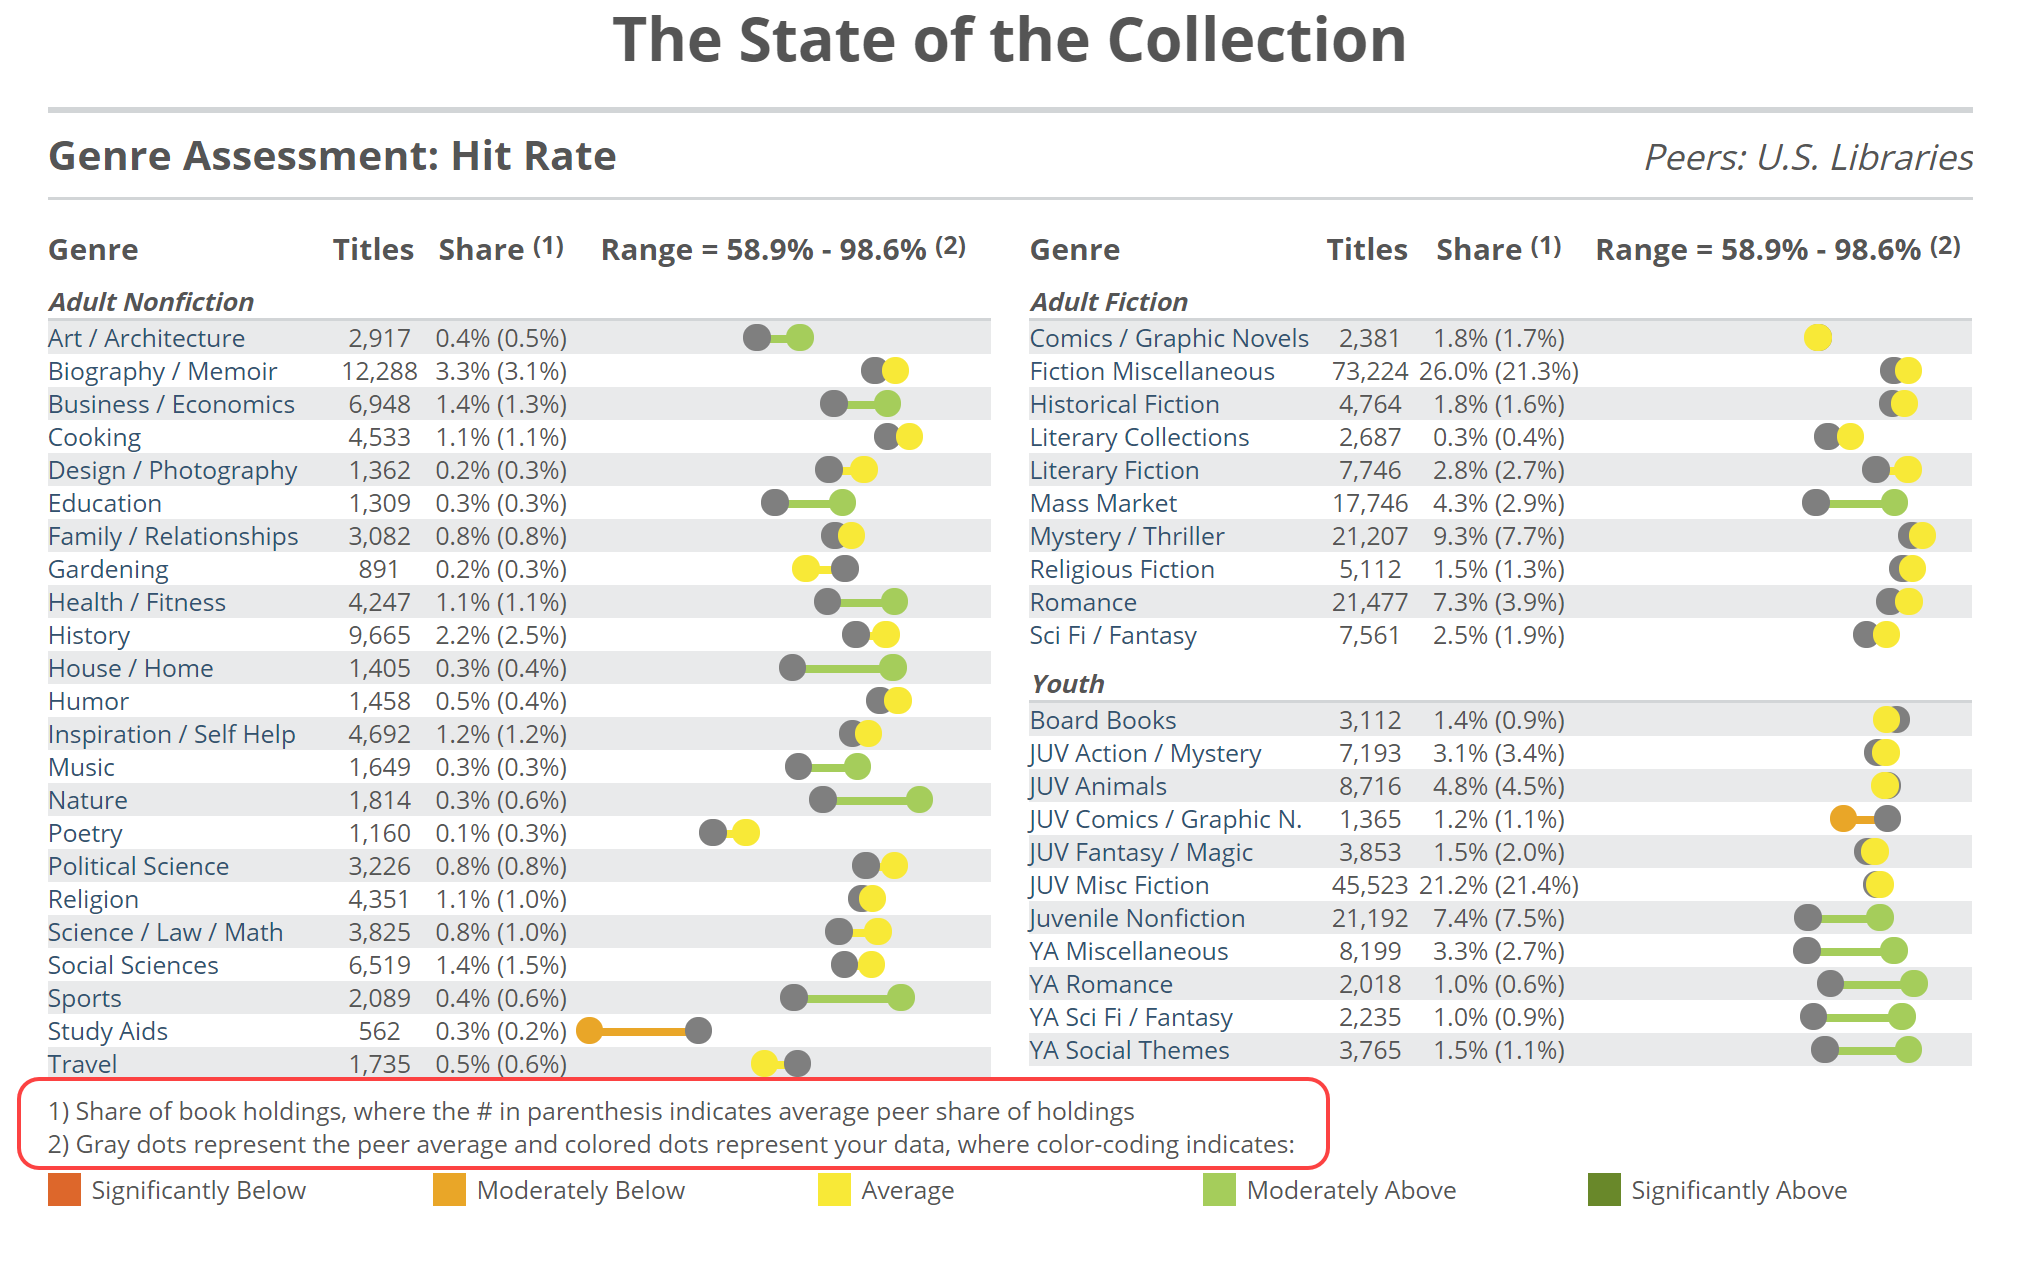
The Genre Assessment pages show 2 pages for each of the 4 Shelf Report Measures. You’ll see a listing of all the genres in three different major categories: Adult Nonfiction, Adult Fiction, and Youth.
The first page for each Measure will look like so:
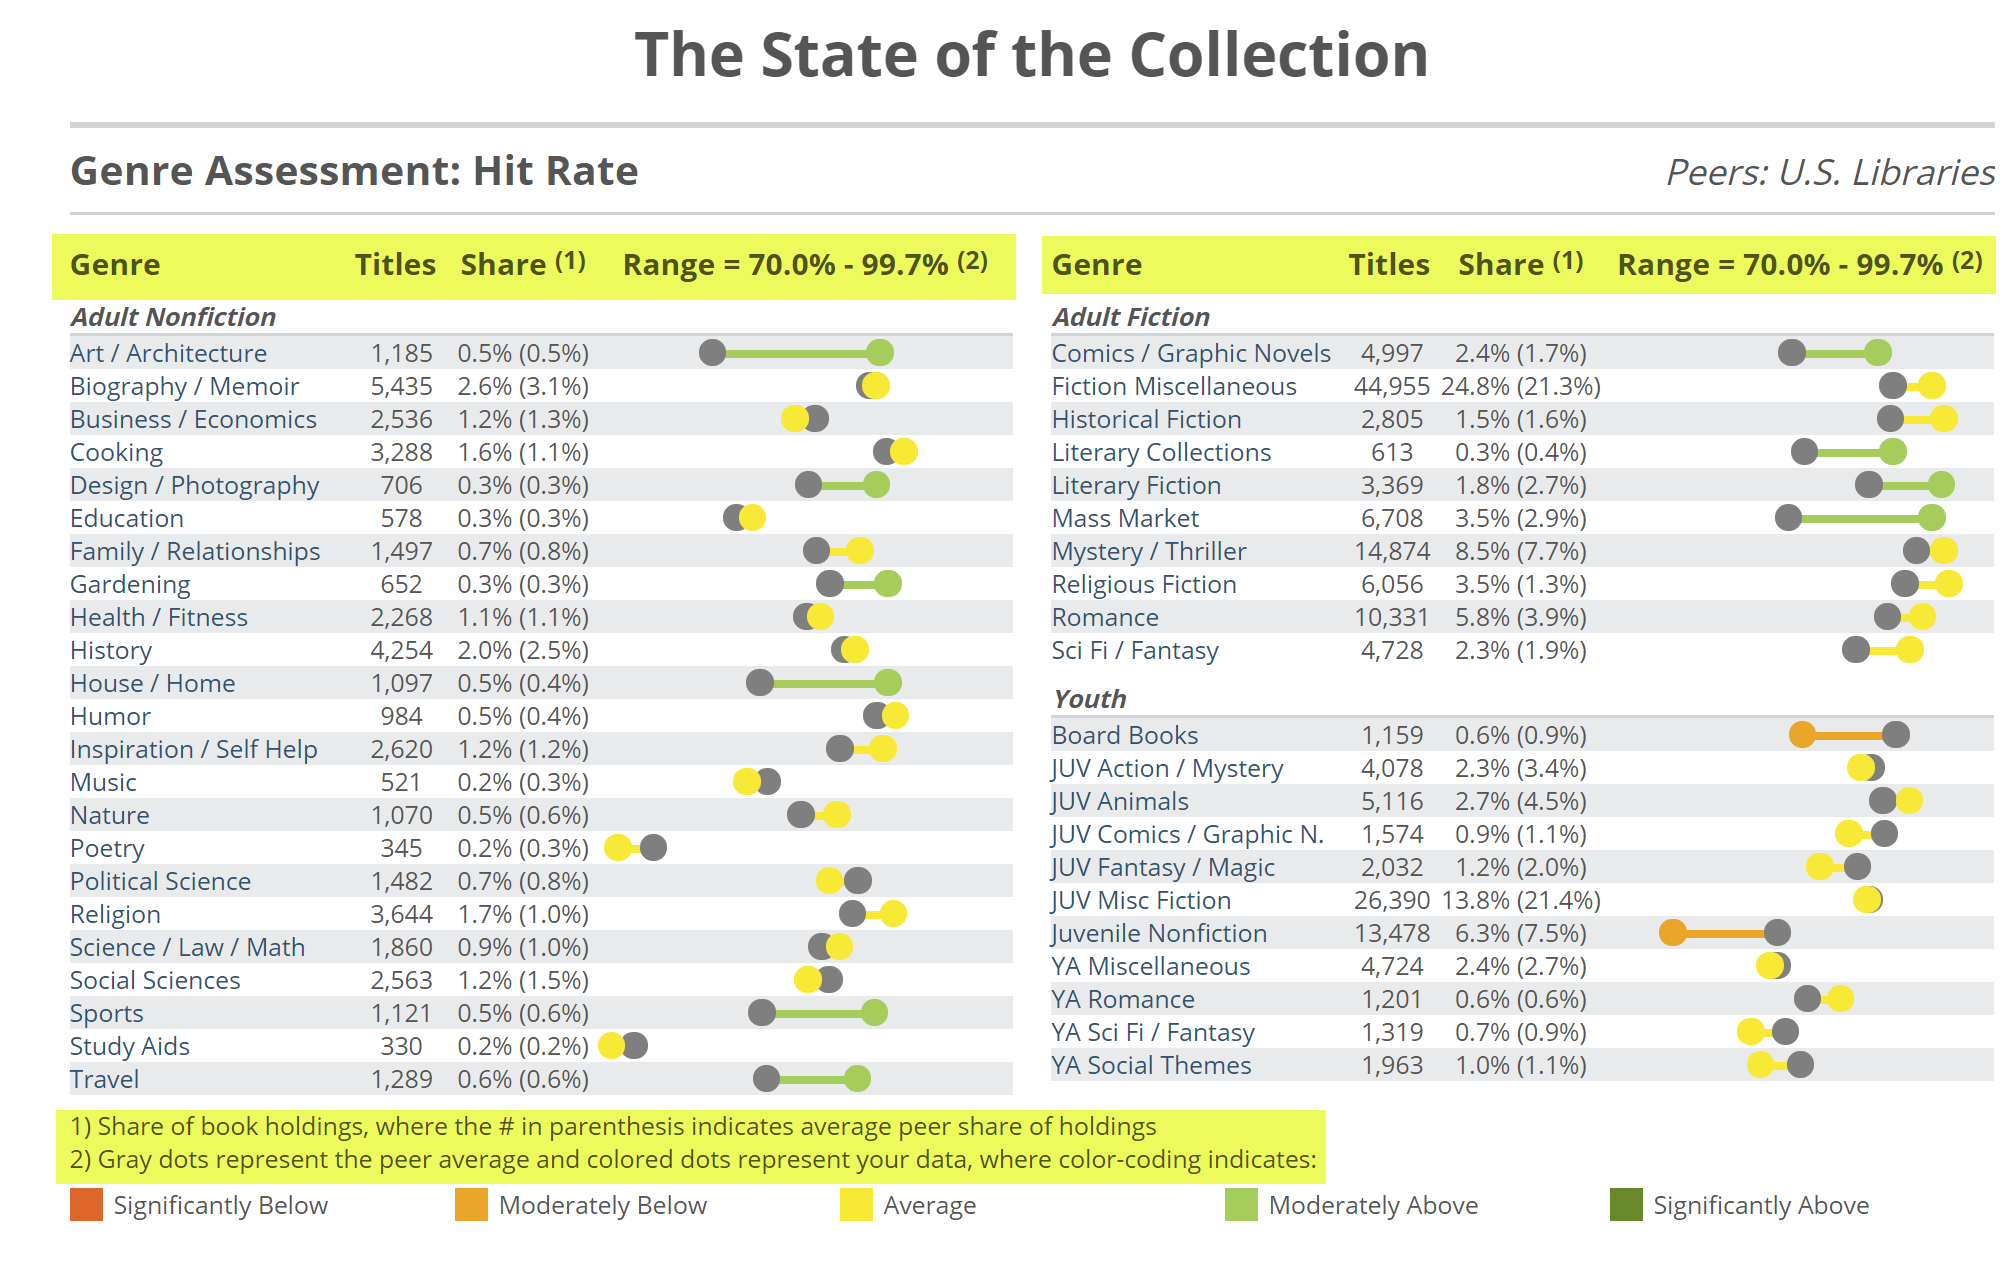
Note that the gray dots indicate the market average for that genre (the average among your public library peers), and your own value is represented by the colored dots. The legend along the bottom of the image shows what the colors of those dots mean, whether average, above, or below. Click on the name of a genre to jump right to the relevant Genre Detail page to dive in even deeper and find specifically what’s going right and/or wrong in that genre of titles. The nice thing about this page is the ability to quickly scan all the genres and see where you’re strongest and weakest at a glance.
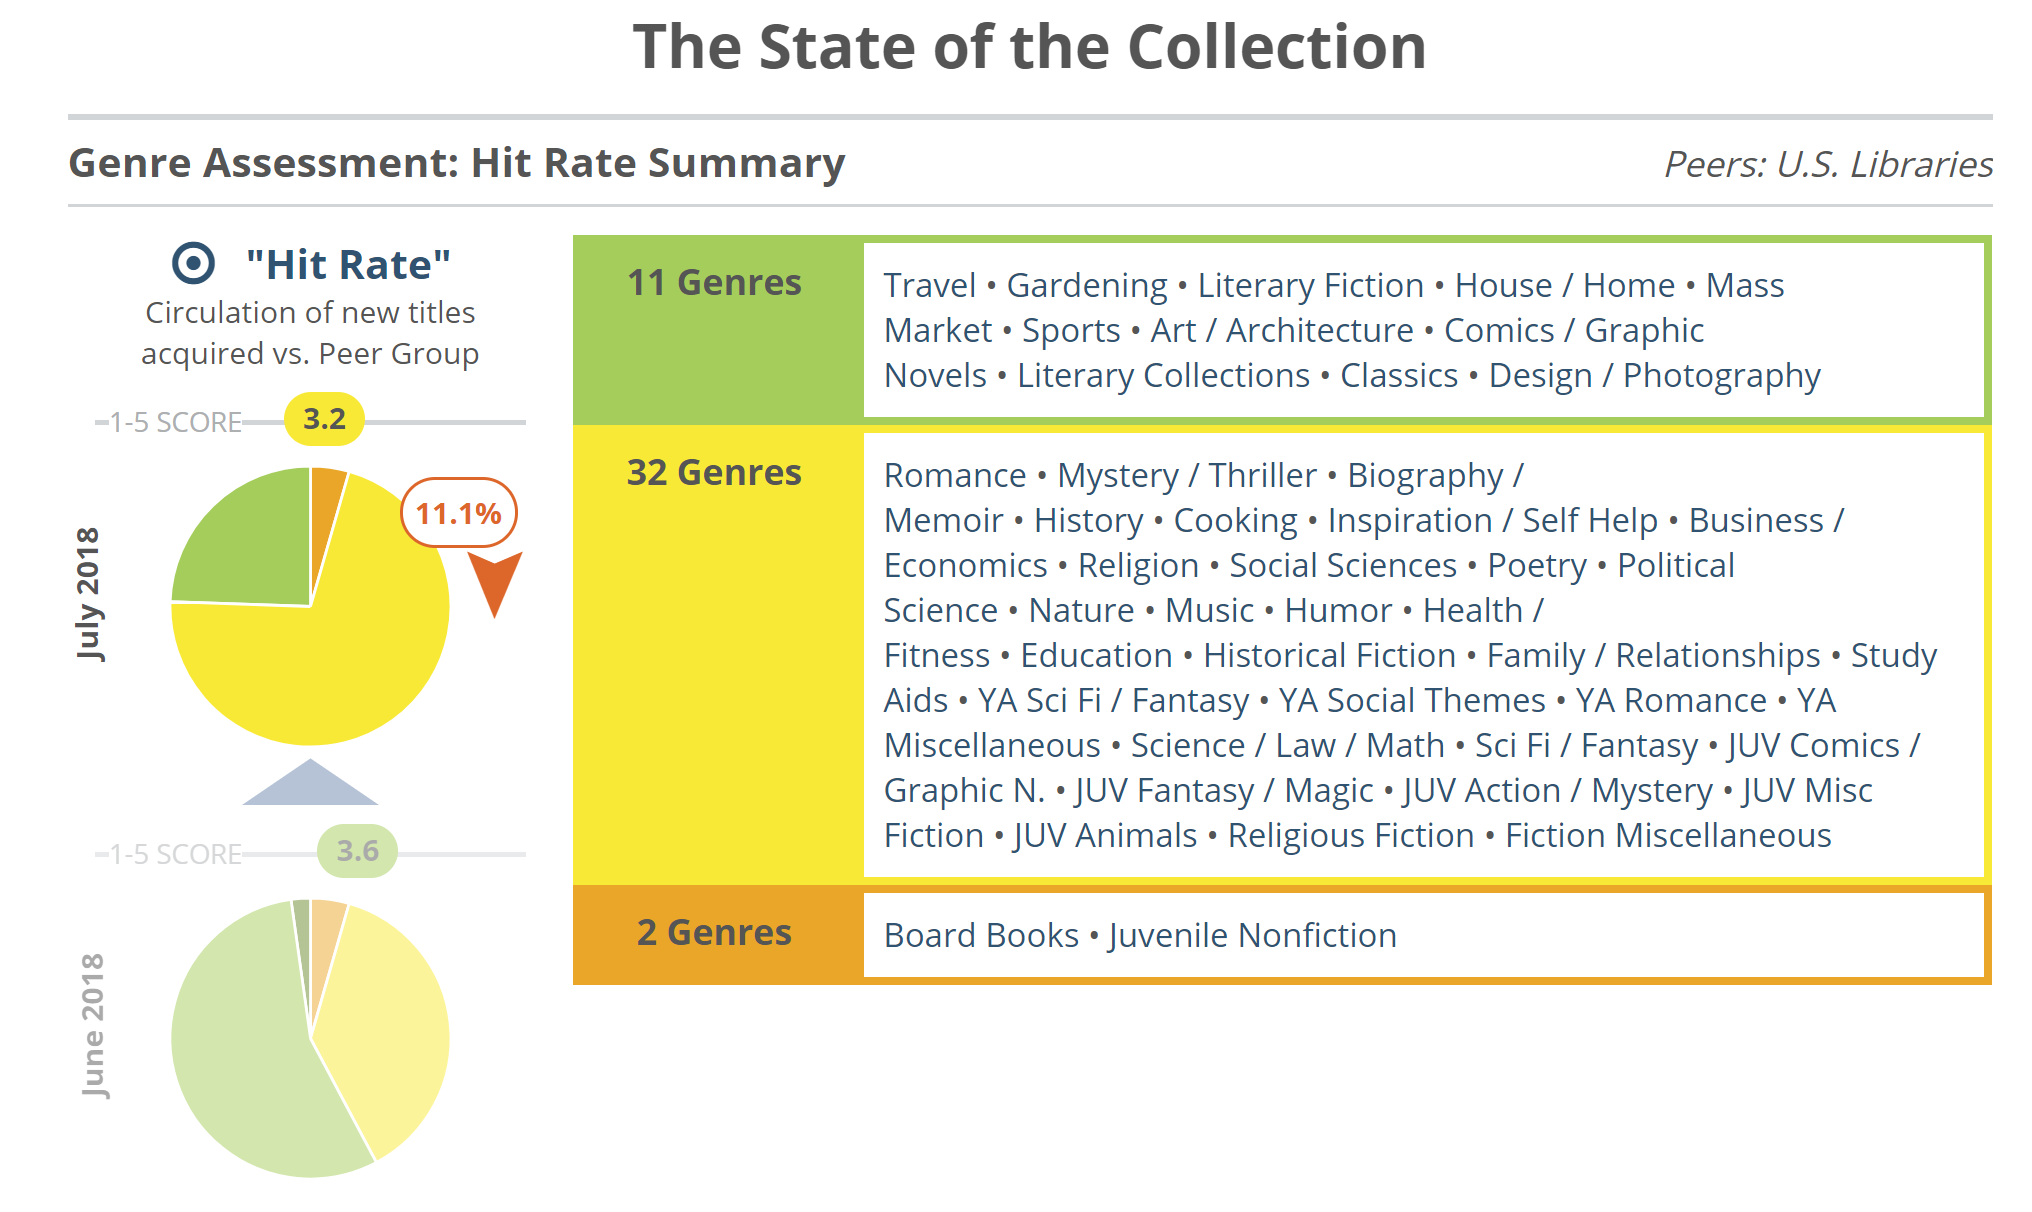
The second page for each measure will show a different sort of summary view that groups each genre according to its relative performance, grouping together genres that are average, above average, etc.
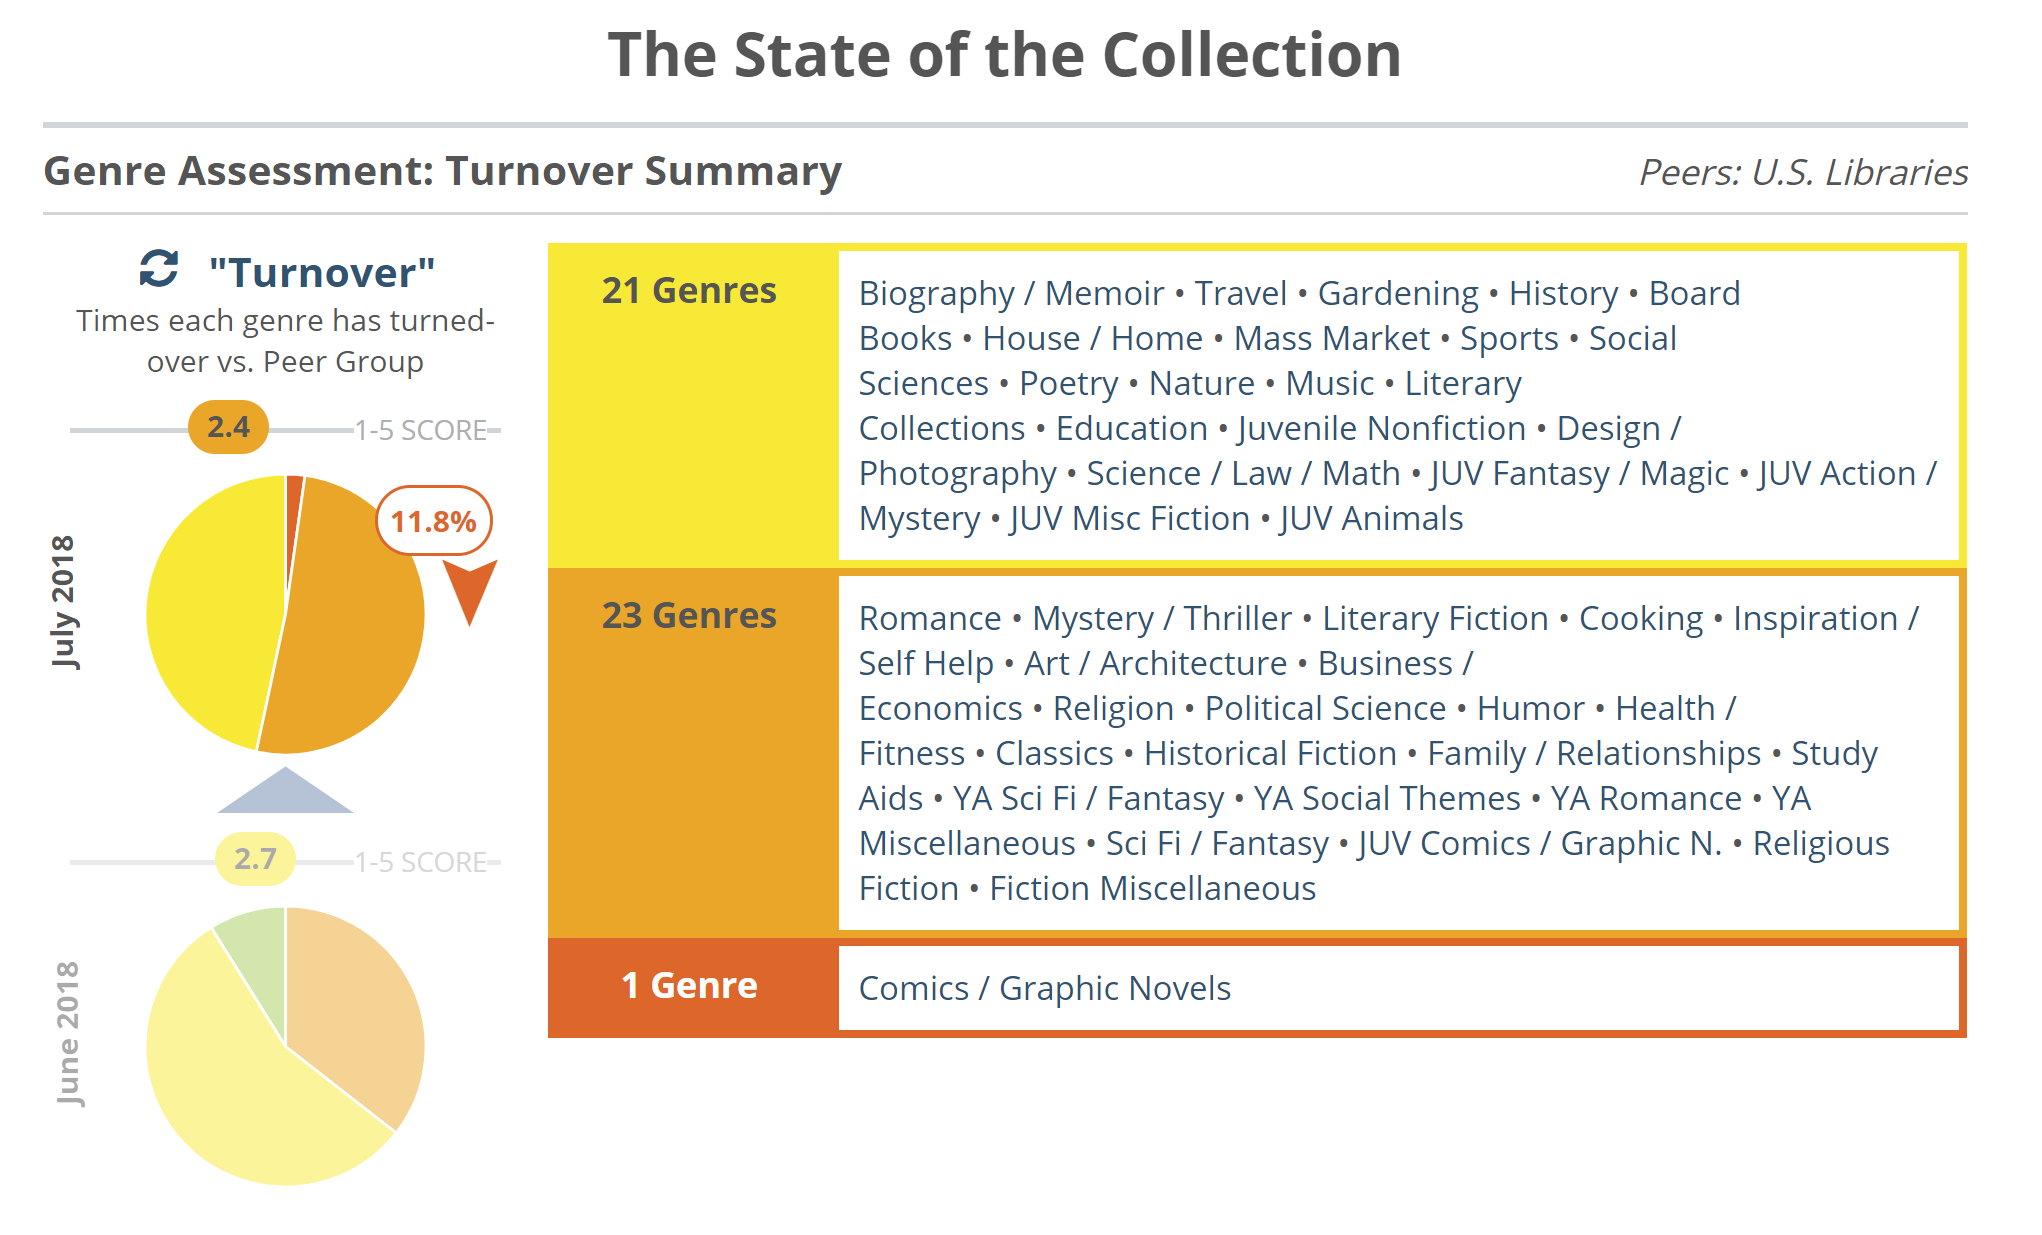
In the example above, this library has below average turns for most of their genres (Weeding!!). The same library’s Hit Rate Summary tells a slightly more optimistic story, with most of their genres landing in the average range. (Hit Rate is a measure of interest in newly published titles that were added to this collection.)
Again, simply click on a genre to dive in to its Genre Detail Page to see what, precisely, is happening and how you can fix it!
Your Genre Detail Pages
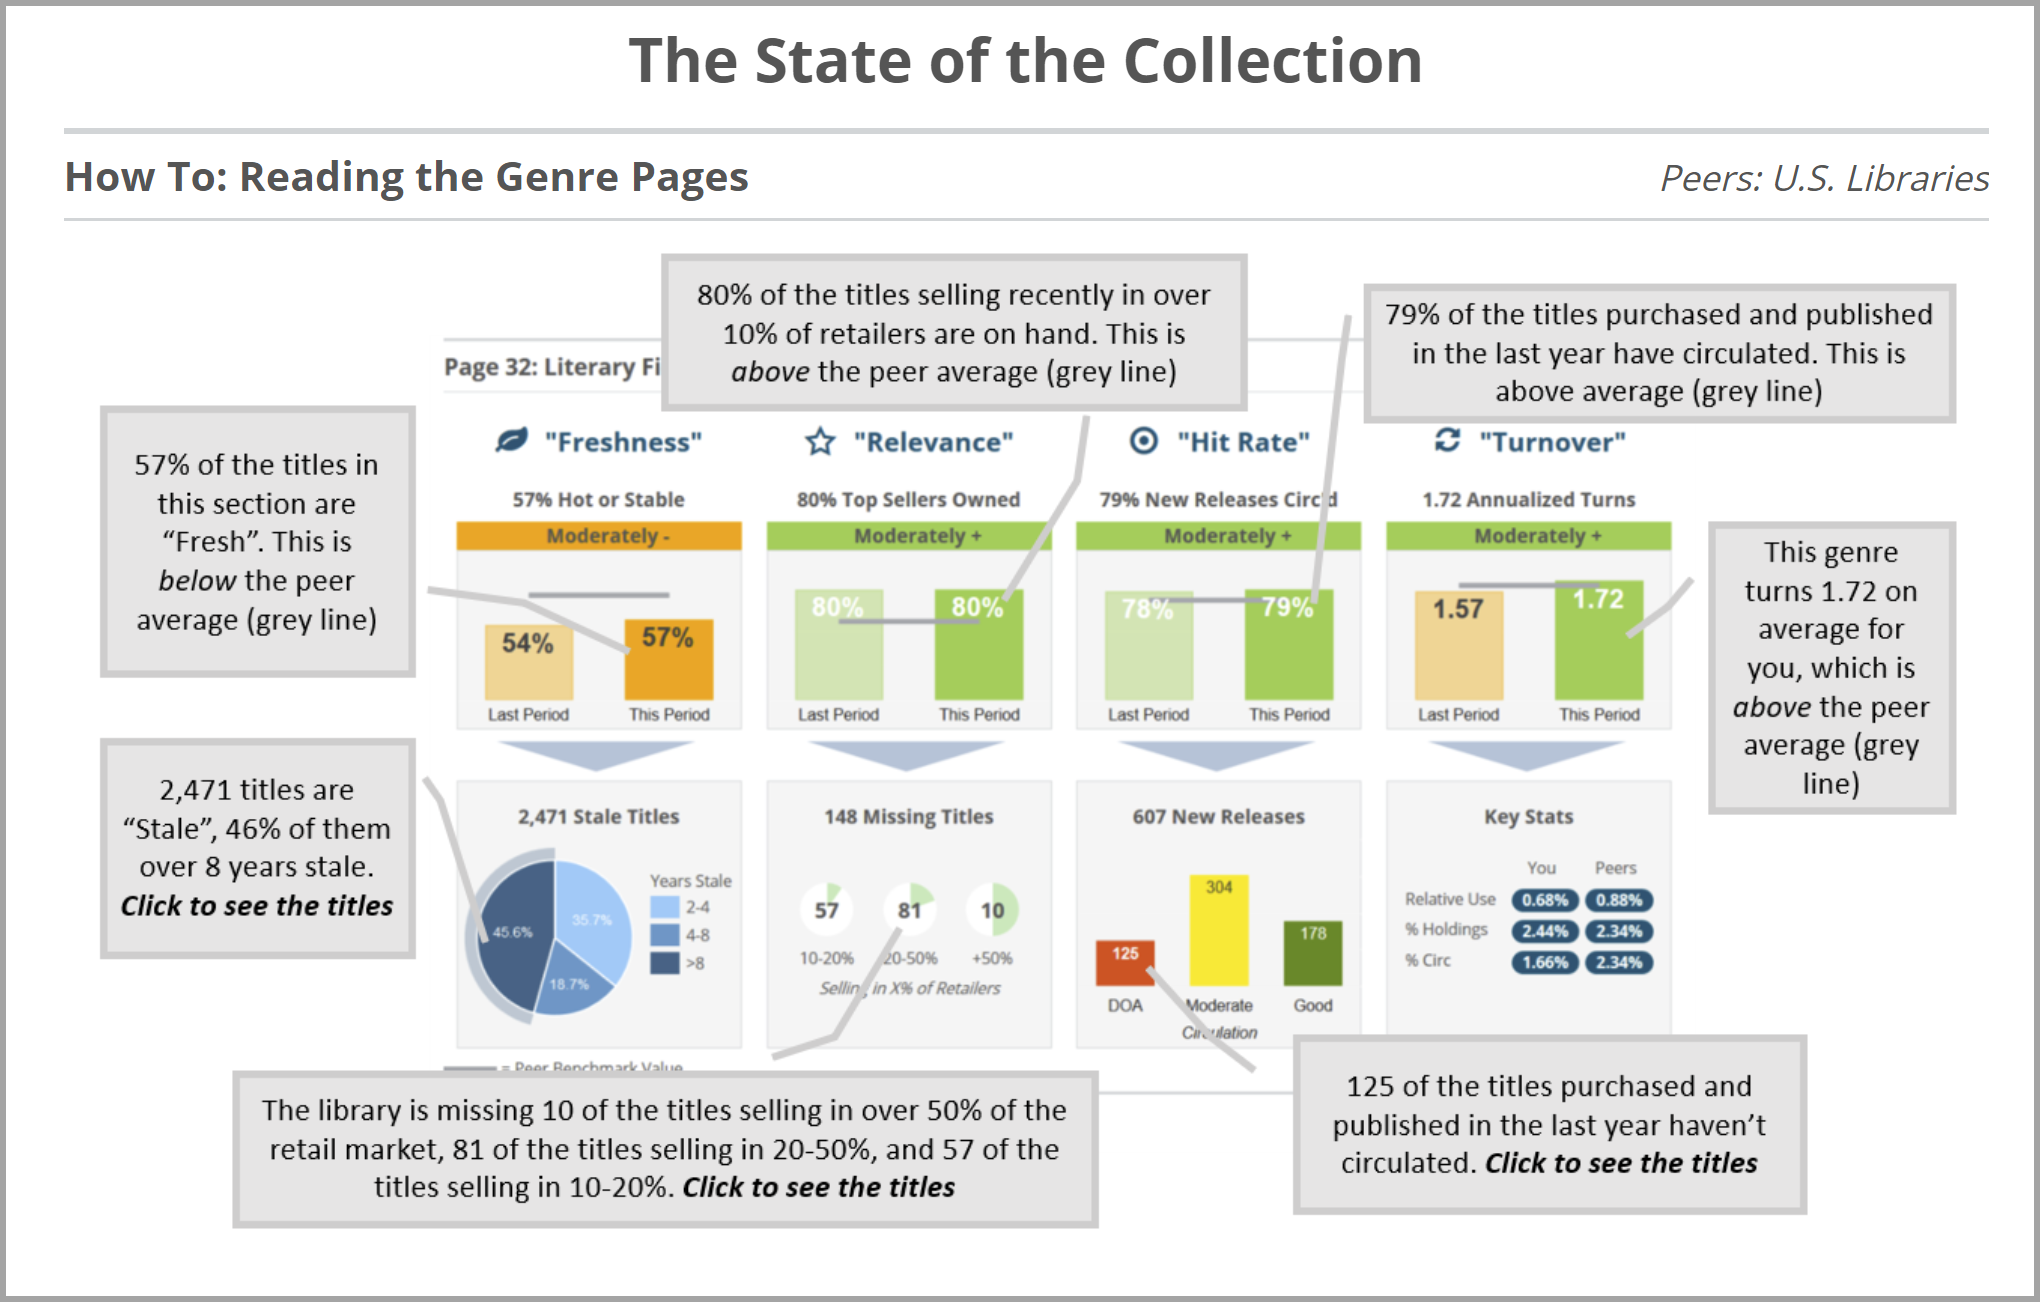
Note that Page 3 of your State of the Collection Report indicates how to read the Genre Detail Pages:
Let’s dive in a bit deeper.
Freshness: Using the Edelweiss+ Analytics Shelf Days analysis, an overall measure of the % of your own collection that is circulating well, or not.
- A “Shelf Days” measure is calculated for every item owned
- Shelf Days = # of Copies Owned multiplied by the days since last activity (checked out, received, added to system)
- Example: 4 copies of a title last checked out 60 days ago would have a Shelf Days value = 240
- Anything with a Shelf Days value less than 730 (2 ‘copy years’) is “Fresh”, anything over that is “Stale”
- A genre’s overall “Freshness” is calculated as the number of “Fresh” titles as a % of total Titles
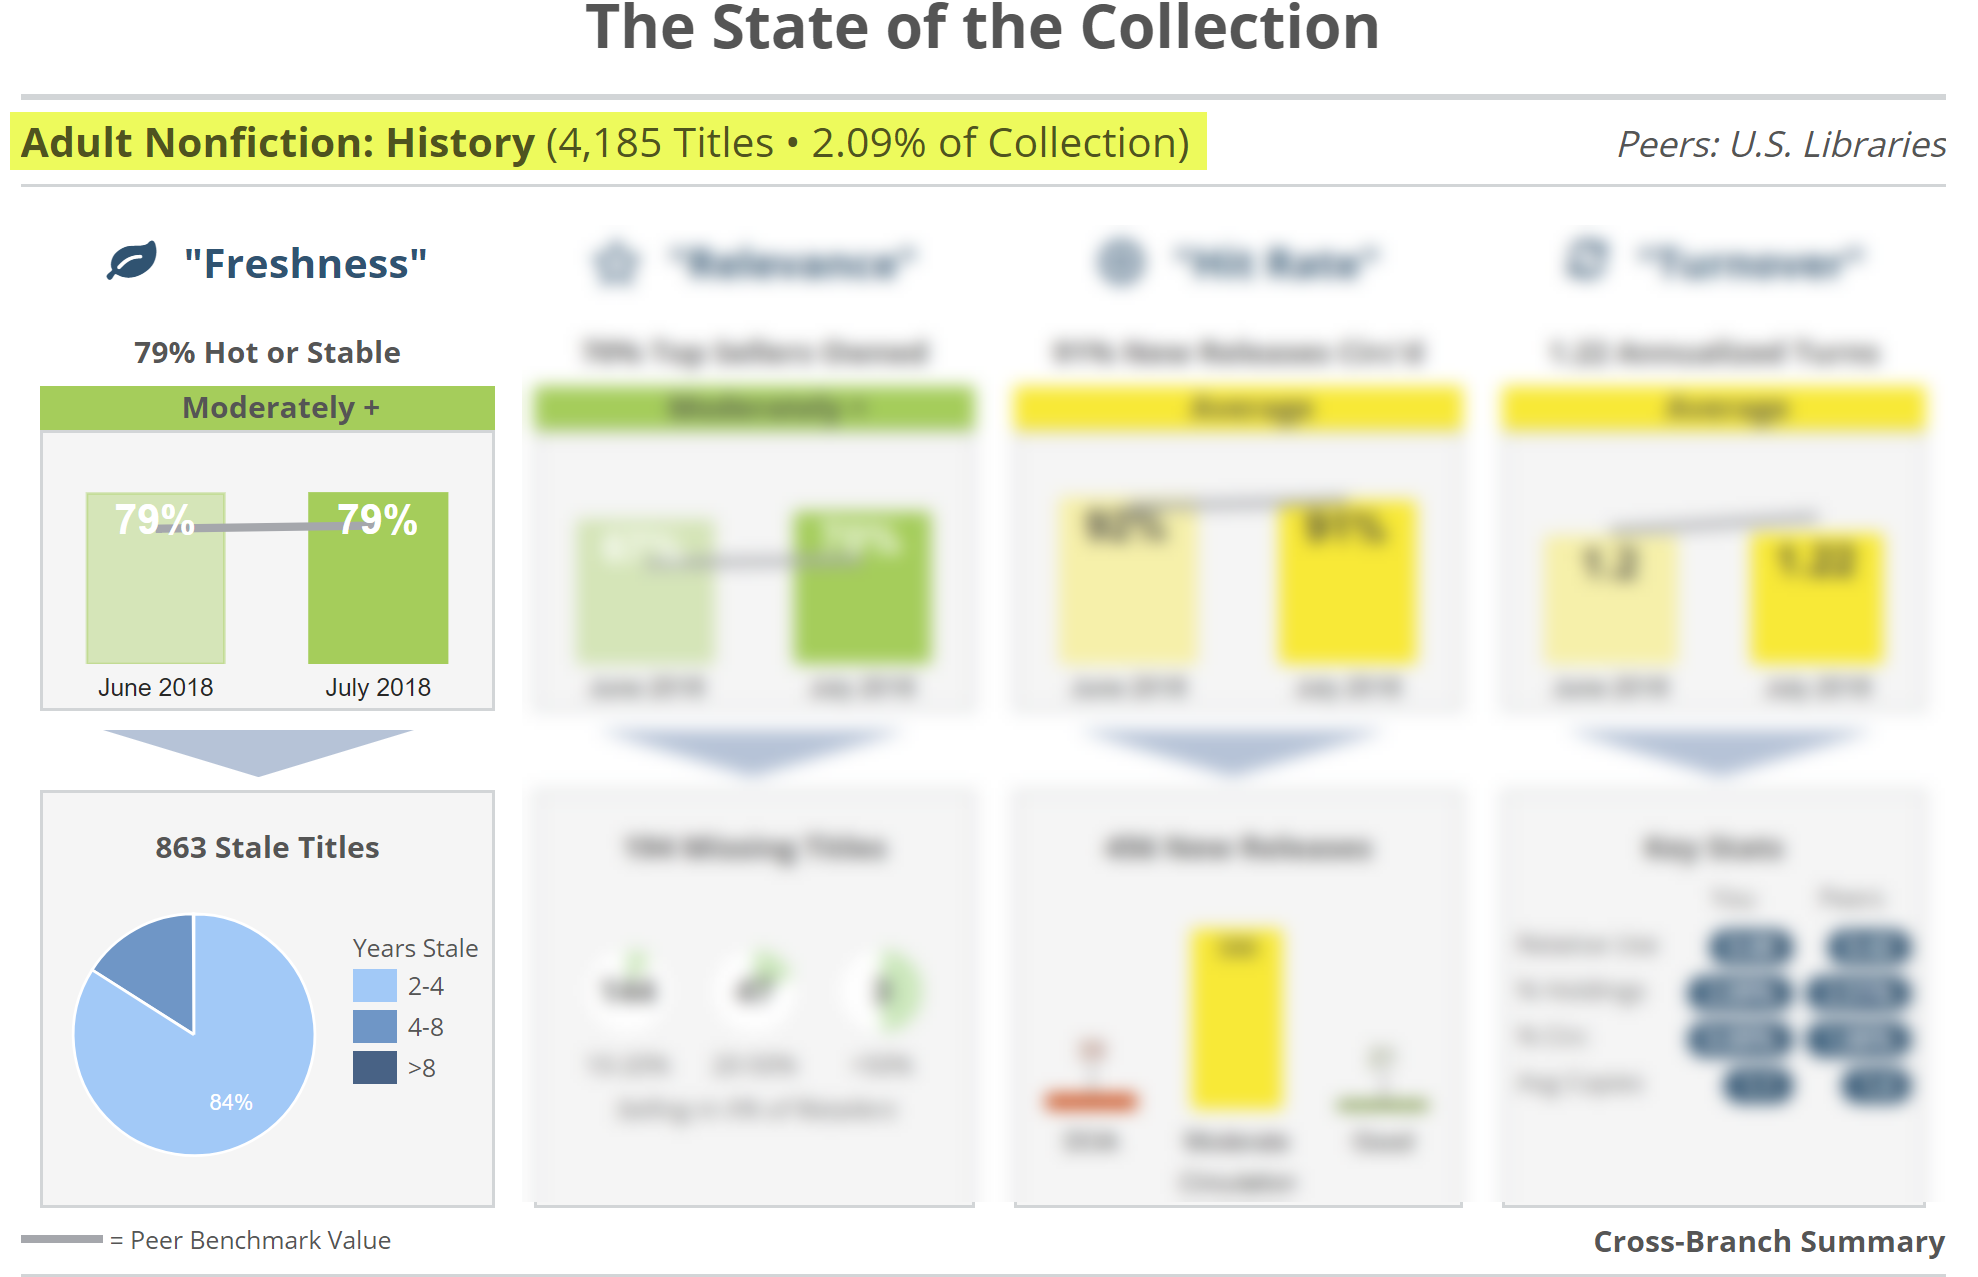
Highlighted at the top of this screen is the name of the genre, along with the total number of titles it contains, along with the % of the total collection it represents. Adult Nonfiction History is 2% of the total collection at this library. It has “above average Freshness,” which means that, for the most part, their History titles circulate pretty well. They do currently have 863 titles that haven’t circulated at all in over 2 years or more. Click on a piece of that blue pie to see which titles are stale (or click on the boxes to the right if the pie section is too small to click on).

The truth here is that while these may very well be great books, this library’s patrons are apparently not all that interested. It could also be that these titles haven’t circulated because they are no longer on the shelf due to theft. You could easily print this out as a “weeding list” by clicking Export to CSV in the upper right and then checking the shelves to see if the titles are there and evaluate them for possible weeding.
Relevance:
Do you own titles that are selling well in the Indie market? Many times patrons will see a book at a bookstore or see it on a best seller list and come straight to the library to borrow it. That is were relevance comes in.
- We identify the titles selling in over 10% of the Indie bookstores across the country in the last 6 months (nearly 500 indies report to us on daily basis)
- The titles are grouped by “family” — to account for different editions / ISBNs of the same title
- Your holdings are analyzed against this list to determine what % of these titles / families you own by genre
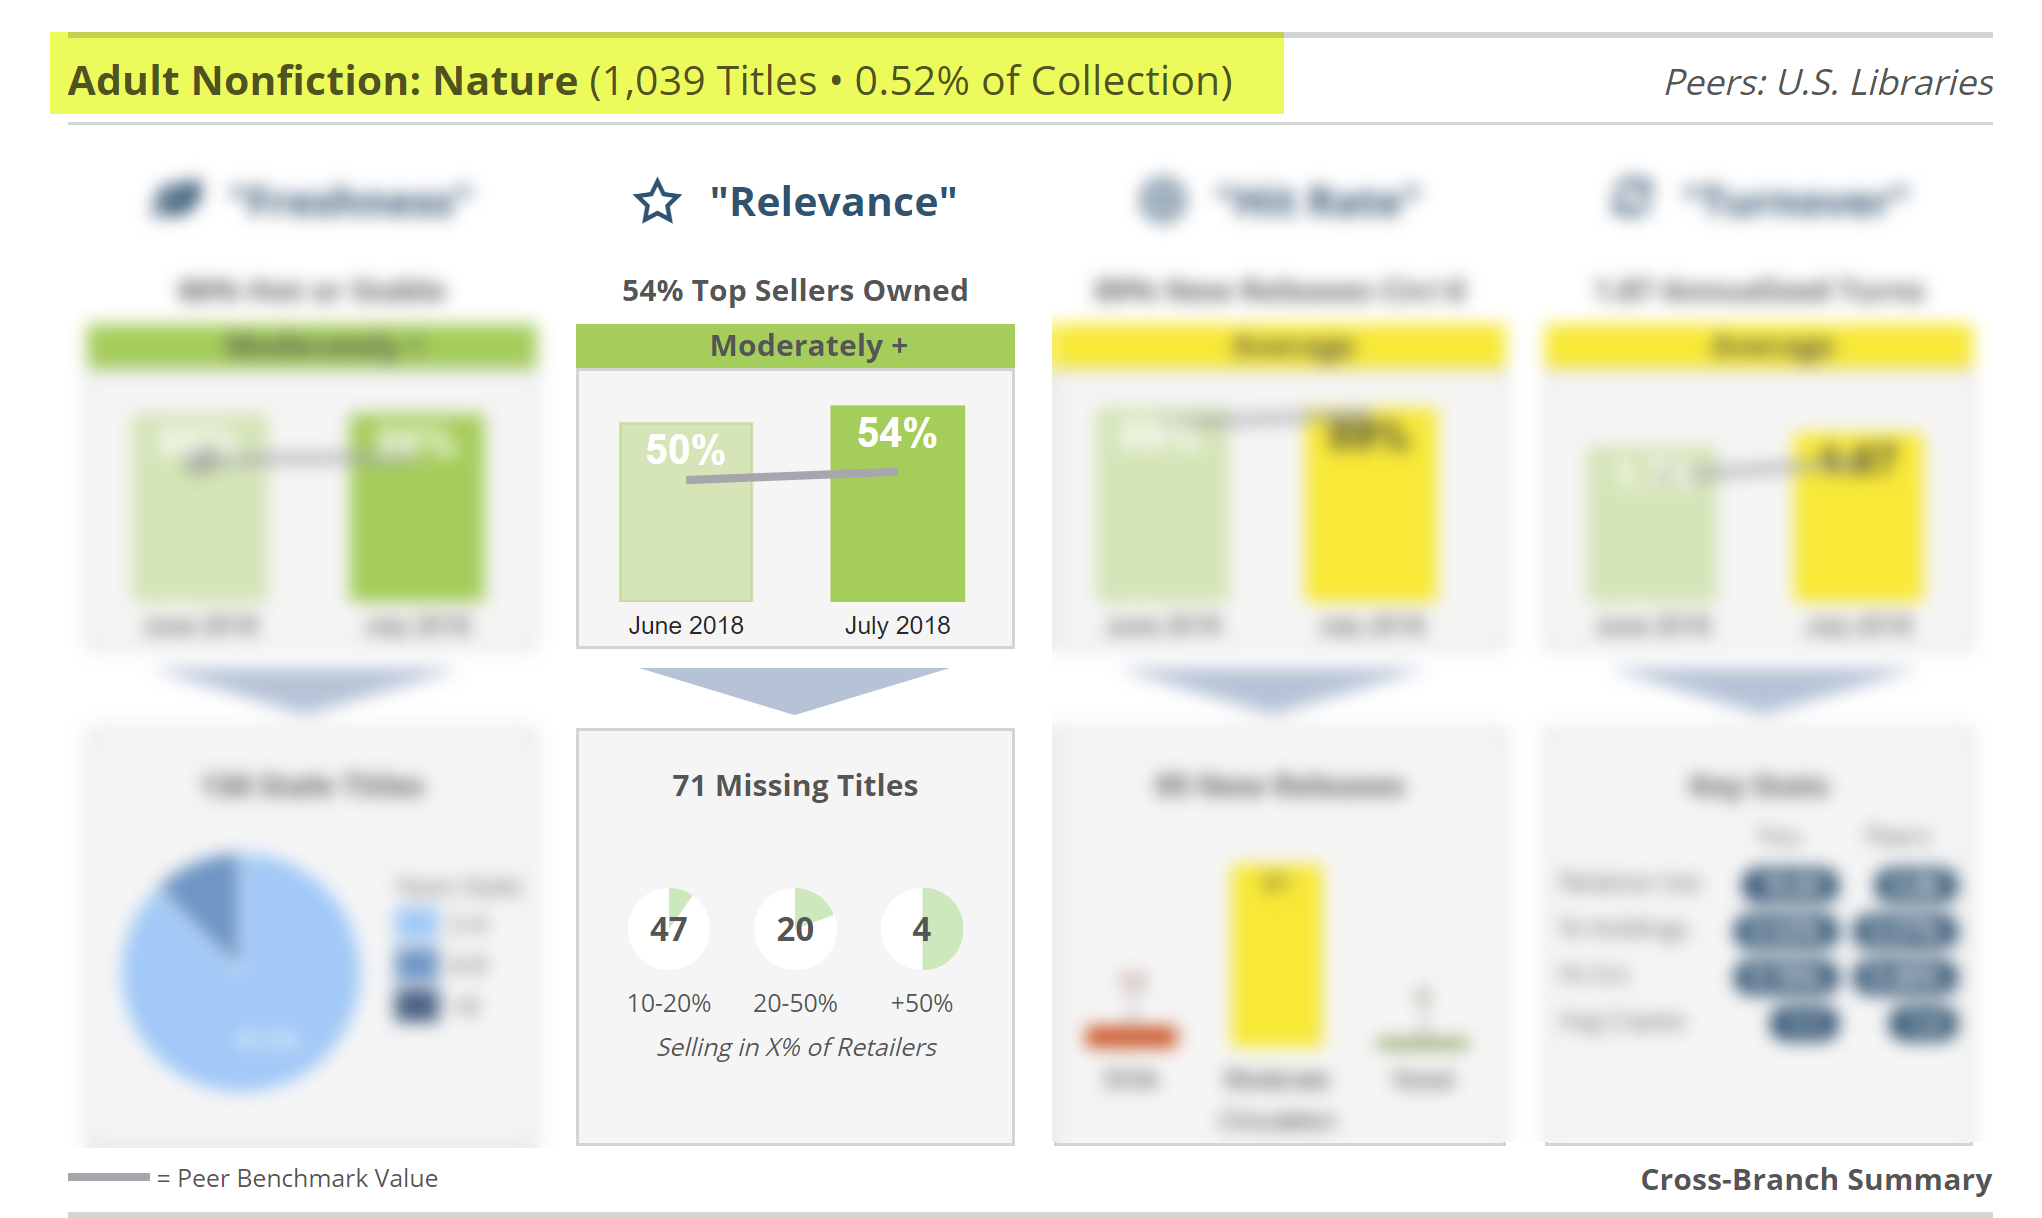
This library stocks 54% of the Adult Nonfiction: Nature titles that indie bookstores have sold in the last 6 months. They’re currently missing just 4 titles that the majority of stores are selling. Clicking on the green section of the pie will show the titles that they are missing.
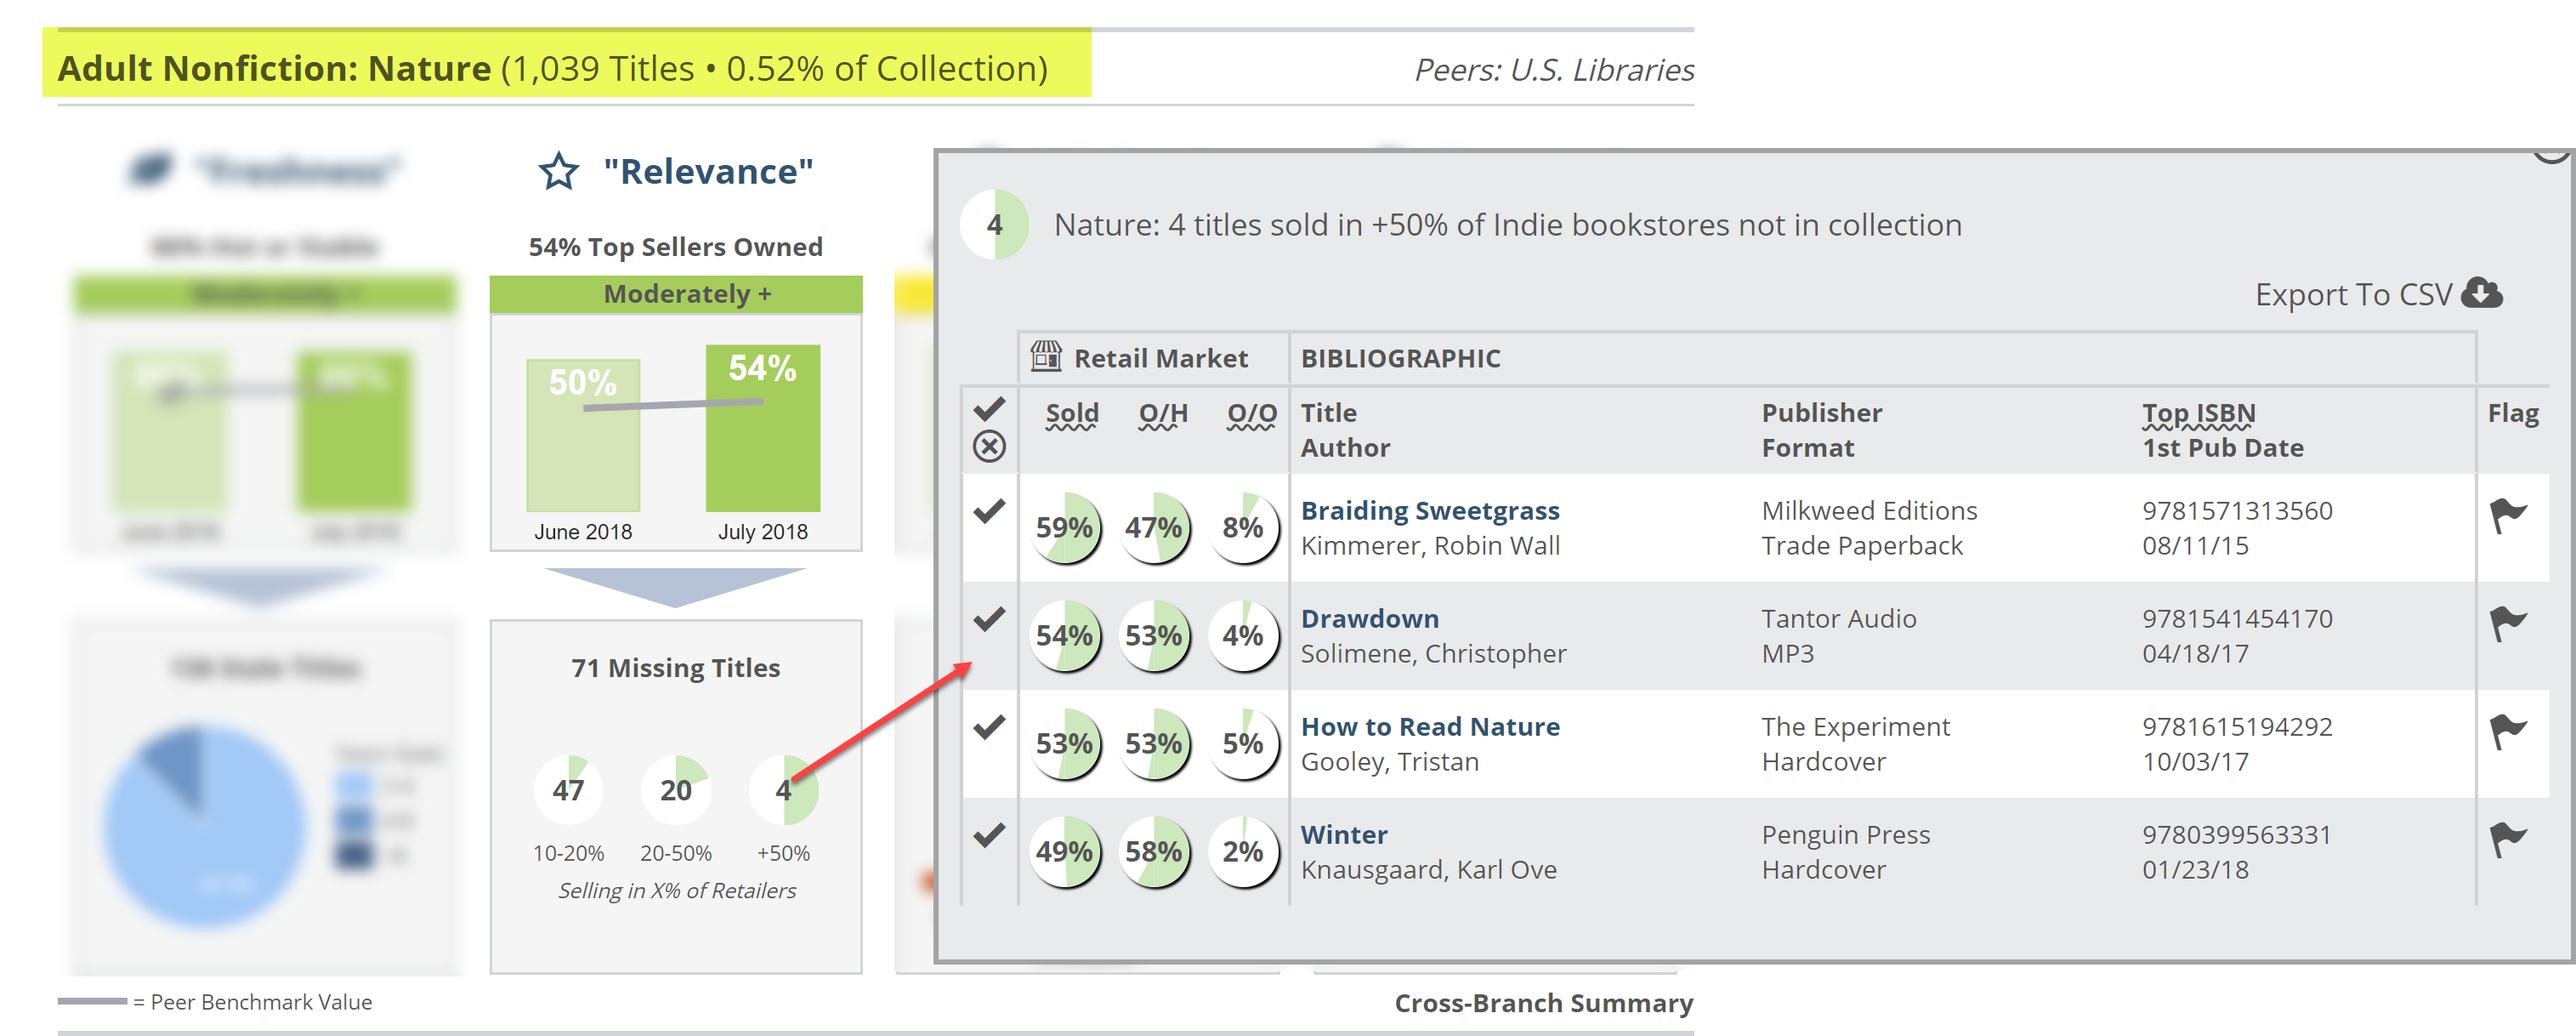
It’s worth noting that there are currently also 136 titles that show up in the Freshness graph as stale in the same genre. So you can swap out the titles that are not circulating for some suitable relevant titles.

Note, too, that the gray bar in the top graph represents the average On Hand % value across the public library market (Peer Benchmark).
Each library has its own personality, and each community has its own distinctive tastes. You know your community and its personality the best but there is still a certain amount of guess work in collection development. Edelweiss provides the data to help in the selection process by providing the information on what is selling well in the market. That being said, sometimes what is selling in the market, isn’t being checked out by your patrons, which brings us to Hit Rate.
Hit Rate:
Measures the effectiveness of new purchases by showing whether or not newly published and purchased titles were ever checked out.
- The titles analyzed here are those that you own and that were published in the last 3 to 15 months
- “Hit Rate” is defined as the number of those titles that have been checked out at least once
- The titles that haven’t circulated are affectionately labeled “DOA” – dead on arrival

Measuring the YA Fantasy/Sci-Fi genre at this library, we can see that a solid 84% of the new titles they purchased were checked out, which is right about the market average. The graph above indicates that 11 of those titles were checked out at least 10 times, and so land in the Good column, 195 were Moderate (1-10 checkouts), and 46 were DOA (dead on arrival…no checkouts). One could reasonably expect to see most of the newly purchased titles to have moderate circulation. It’s a relatively short list, and surely worth checking out, but the points of interest here are the outliers. The titles that circulated the most were clear wins, and knowing which titles those are will only serve to better inform you on the titles that do the best in this genre.
Of course, going the other direction, you definitely want to know which titles were never checked out. If you can come up with a reason why, that would of course be ideal. Printing the list and taking a trip to the shelves might be painfully illuminating. Display issues are relatively easy to fix, but those intangible reasons that your patrons are simply not interested in a title (or 46 titles) are worth exploring. Obviously, allowing that information to inform future purchasing is probably a wise course of action. Click in each column to see a list of those titles. In that list, click on a title to see its page in Edelweiss.

Turnover:
Turns indicate how many times per year the average title circulated, a good overall measure for how hard your collection is working for you.
- Collection turnover is a very common measure used to look at the overall efficiency of a collection
- The calculation is as follows: Total 6 month circulation in units divided by the average collection size in units — and then multiplied by 2 to annualize the number
- Theoretically, collection turns represent the number of times per year the average title circulated
This measure essentially indicates not only how briskly your titles circulate, but whether or not your collection is overburdened with stale titles. As a general rule of thumb, a turn level of 3 indicates a relatively healthy collection. Inevitably, if you see a genre with low turns, you’ll also see a large amount of Stale titles in its Freshness measure.

It’s relatively easy to see ways in which this category’s turns could improve… Weed the stale stuff, pay attention to that out-sized DOA column, etc. A library is constantly bringing in new titles, so it makes sense to constantly adjust the collection to make room for those new titles and adjust according to your patrons’ interest.
The Key Stats box shows a few points of interest:
- Relative Use: A ratio showing the difference between the % Holdings and % Circ numbers. A Relative Use number of “1” indicates balance. Less than 1 is overstocked, and over 1 is understocked, relatively speaking. The farther from 1, the more out of balance things are.
- % Holdings: The % of your total book collection represented by this genre.
- % Circ: The % of your total circulation represented by this genre. In the example above, this library’s Travel category circulation accounts for .39% of the total.
- Avg Copies: The average number of copies on hand for each title.
The Cross-Branch Summary provides a quick peek at how all your branches measure up with the specific genre you’re currently viewing:
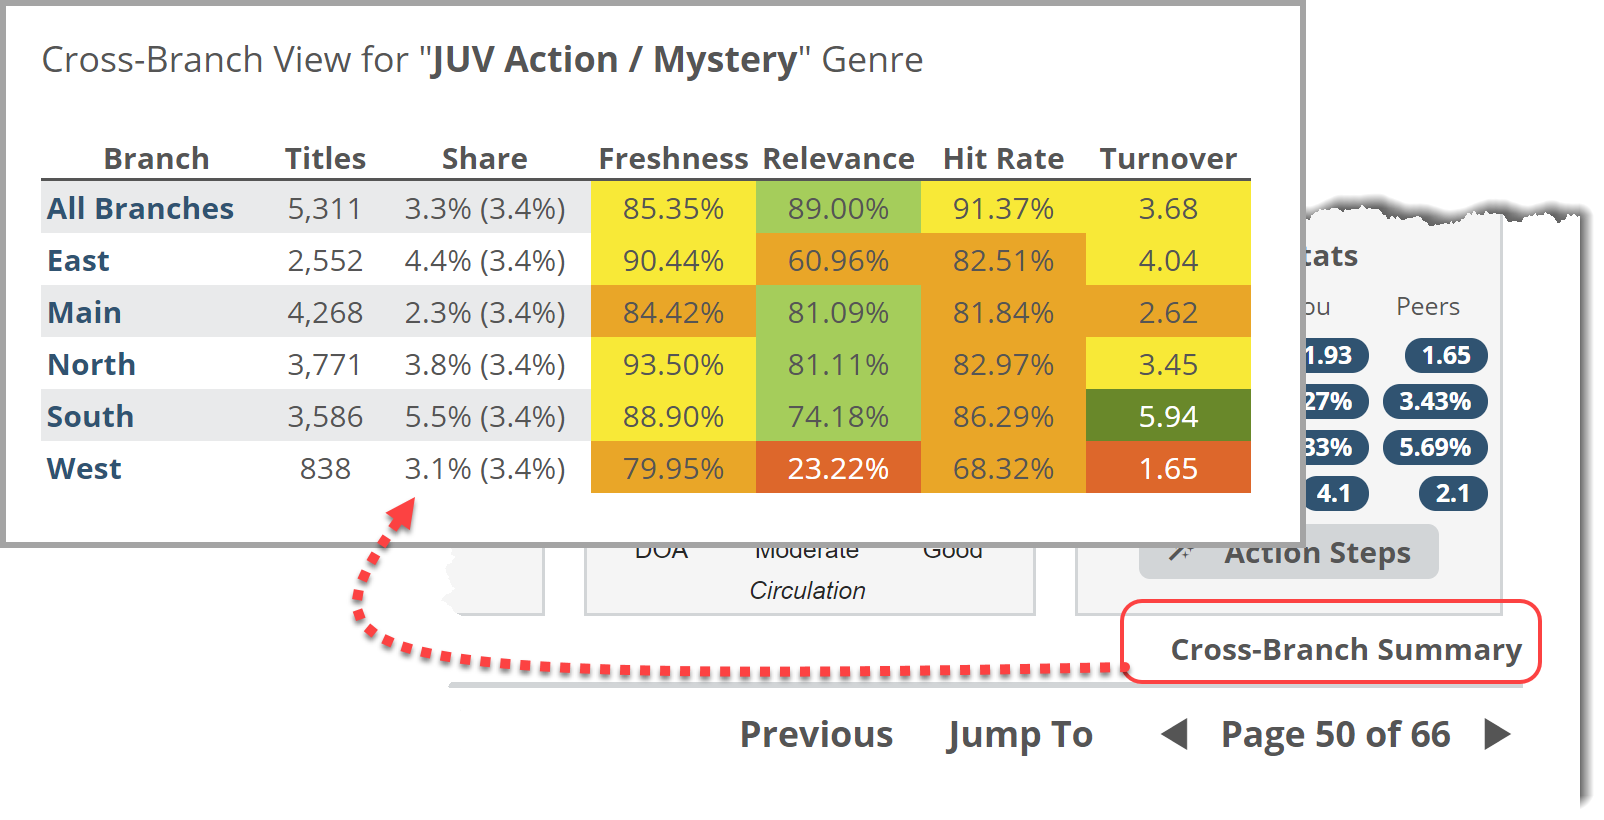
If you work hard and manage your collections effectively, you can see some extraordinary results:
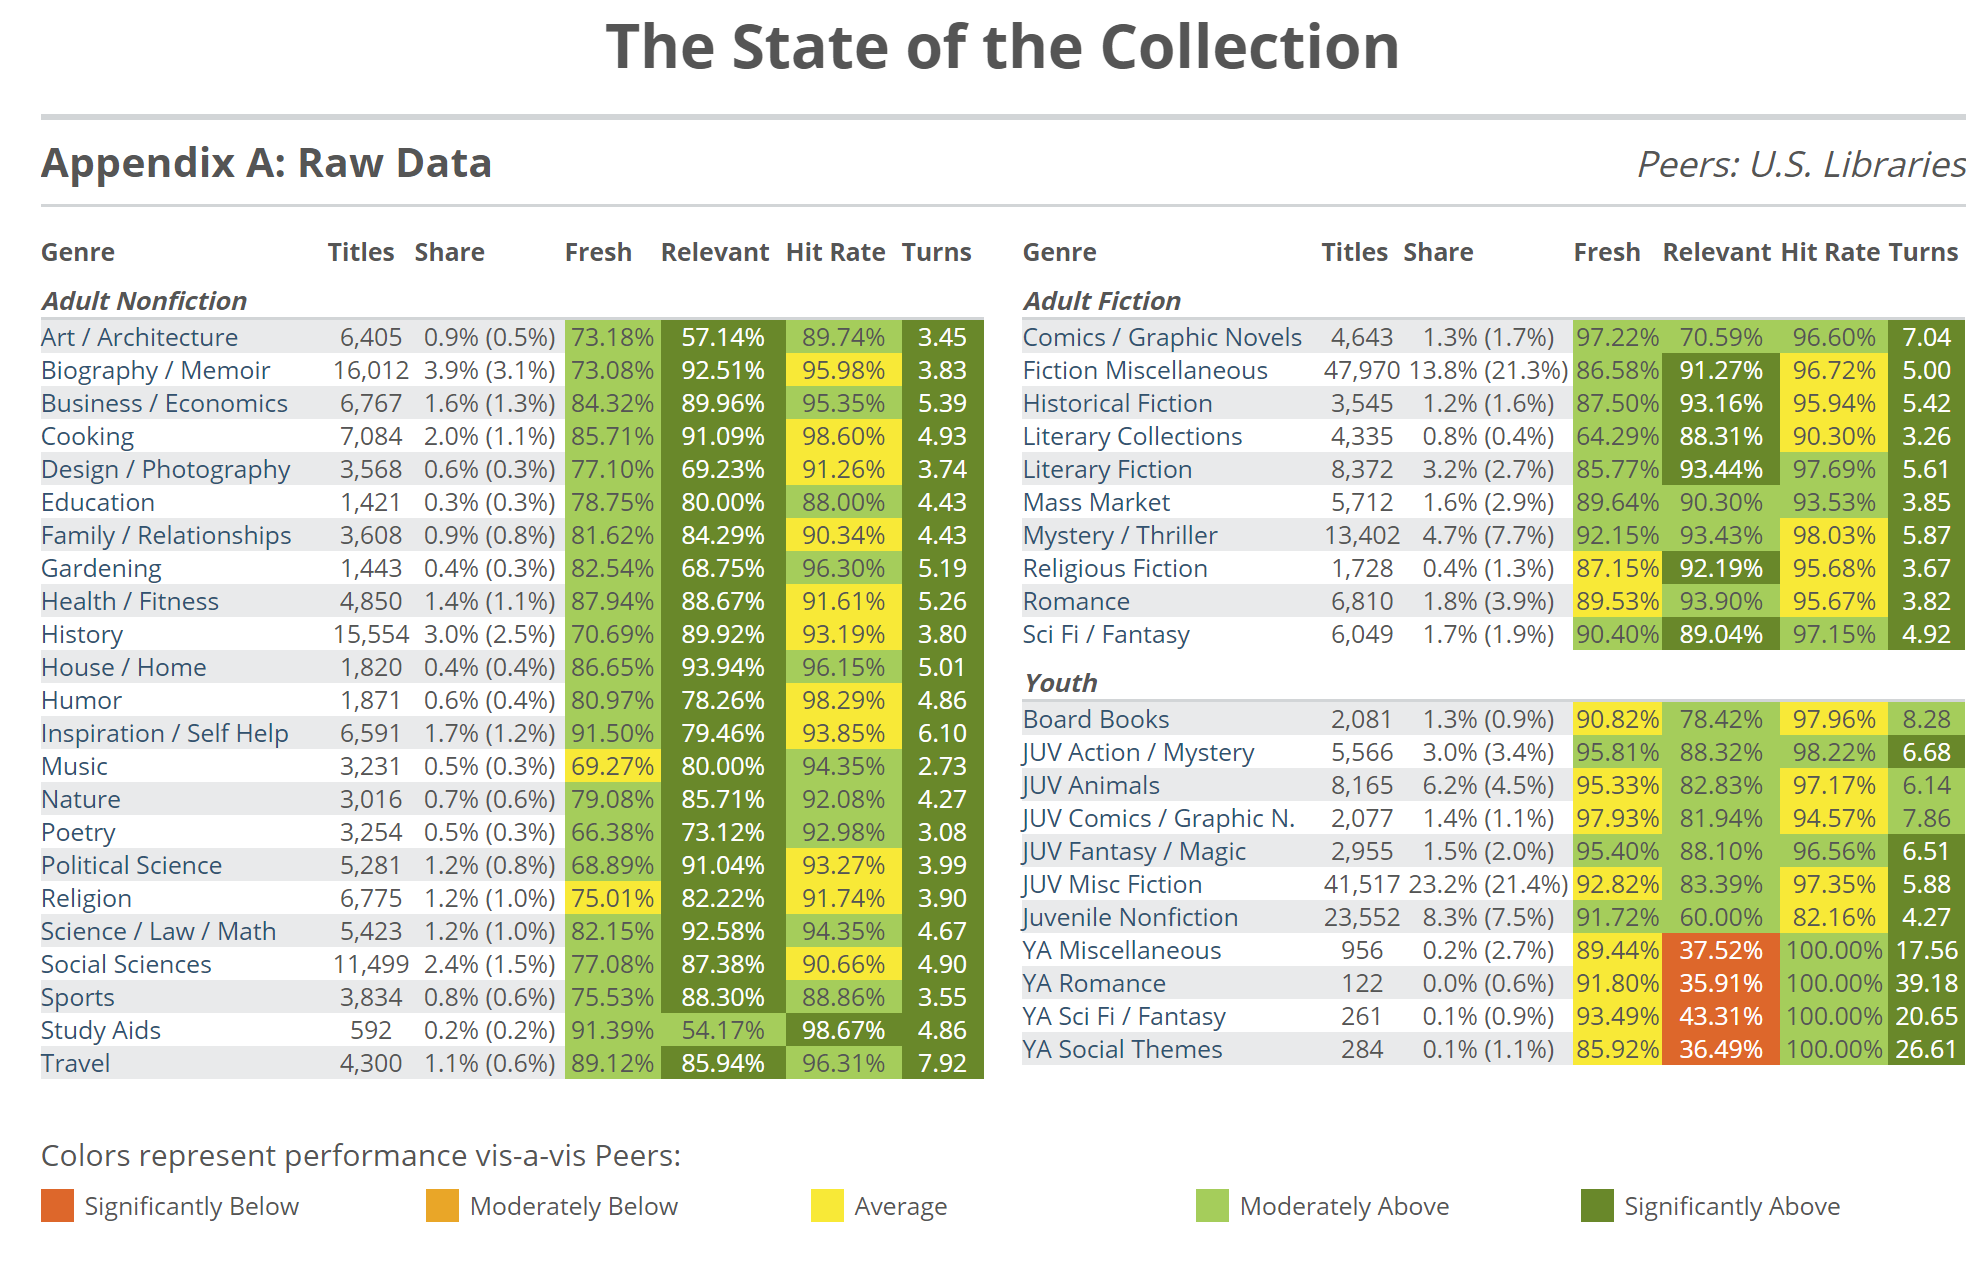
Appendix A: Raw Data
The Raw Data report displays a chart indicating all 4 measures for all listed genres, all on one page.
You’ll see columns for:
- Genre: Name of the Genre…of course
- Titles: # of titles on hand in that genre
- Share: Percentage of your total book collection represented by this genre. The (%) in parenthesis indicates the market average for that genre. So, comparatively, how large your peers’ sections are compared to your own.
- Fresh, Relevant, Hit Rate, and Turns: the 4 Shelf Report measures, your own performance compared to your peers. Details about those here.
Below is a pretty “Above Average” example. It has a few spots that need work, of course!
How does yours look in comparison?
Using Super Categories
Super Categories are a handy way to quickly create groups of your Shelf categories (what your library uses to shelve books like Dewey number or Teen Fiction) in order to make measuring those groups as easy as possible. Think of it as applying tags to collection codes instead of individual titles. This is available to Summit customers.
Generally speaking, the State of the Collection Report will provide you with an objective assessment of the strengths and weaknesses of your library’s collections, identify specific areas to focus on, and enable you to track improvement over time. When viewing Your Codes within the State of the Collection Report, comparison to other library systems is not possible, because those systems will classify their content their own way, using their own codes. You are still able to use that report to gauge the performance of your own collection codes.
Here’s how to set them up:
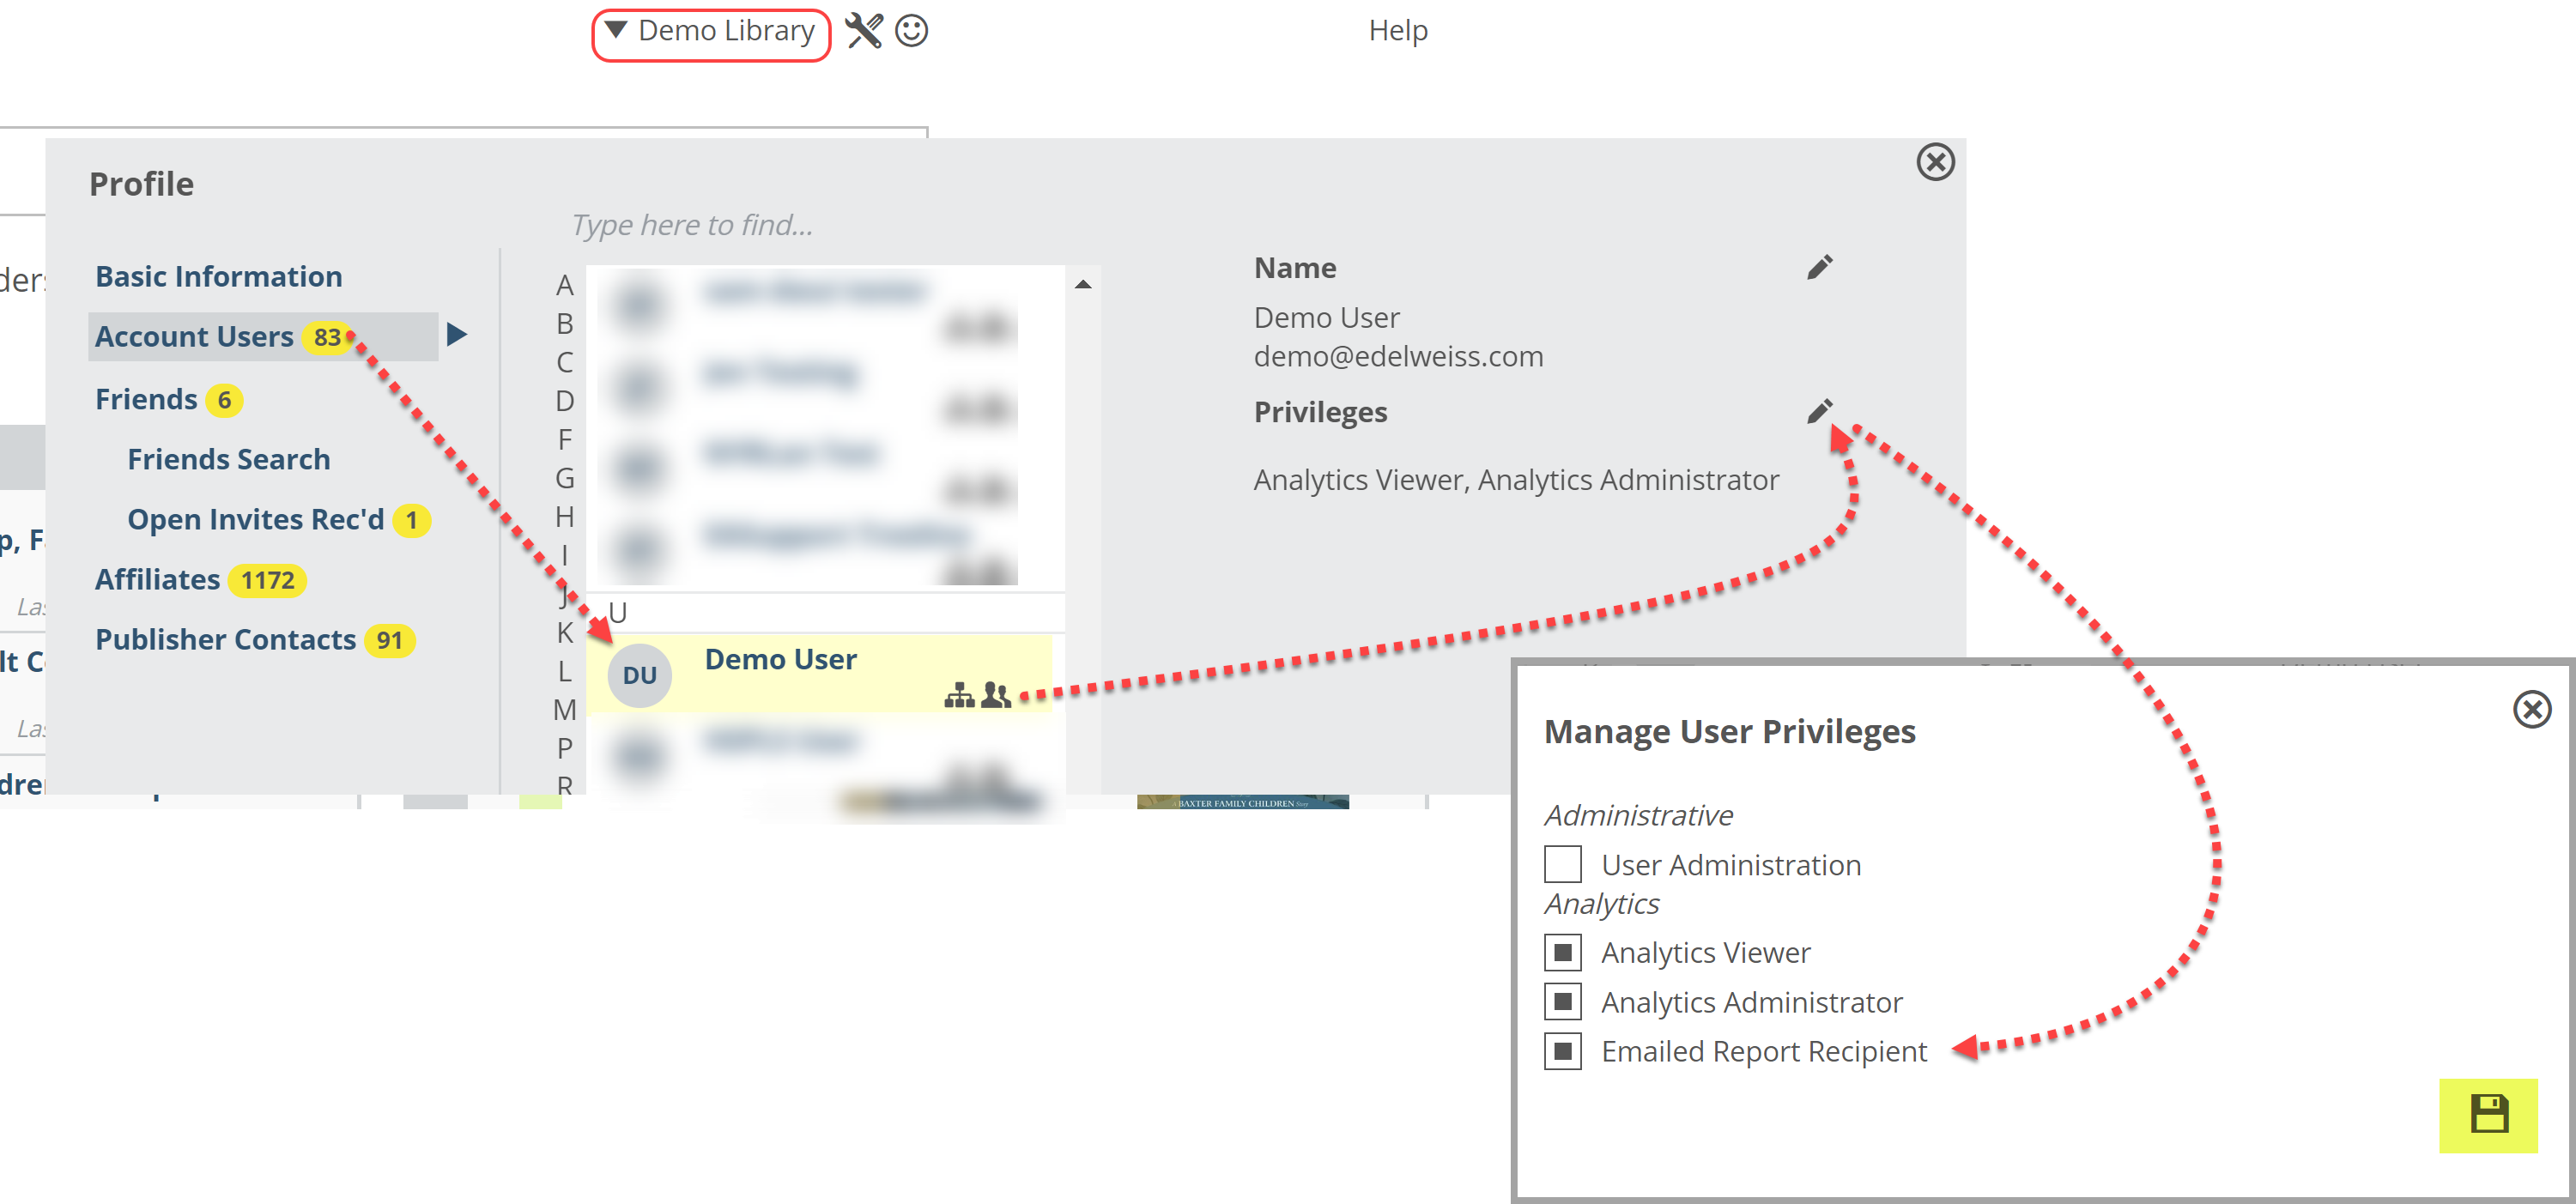
First, your account must have the Analytics Administrator privilege to create Super Categories. Click on your name at the top of any page to see your Privileges.

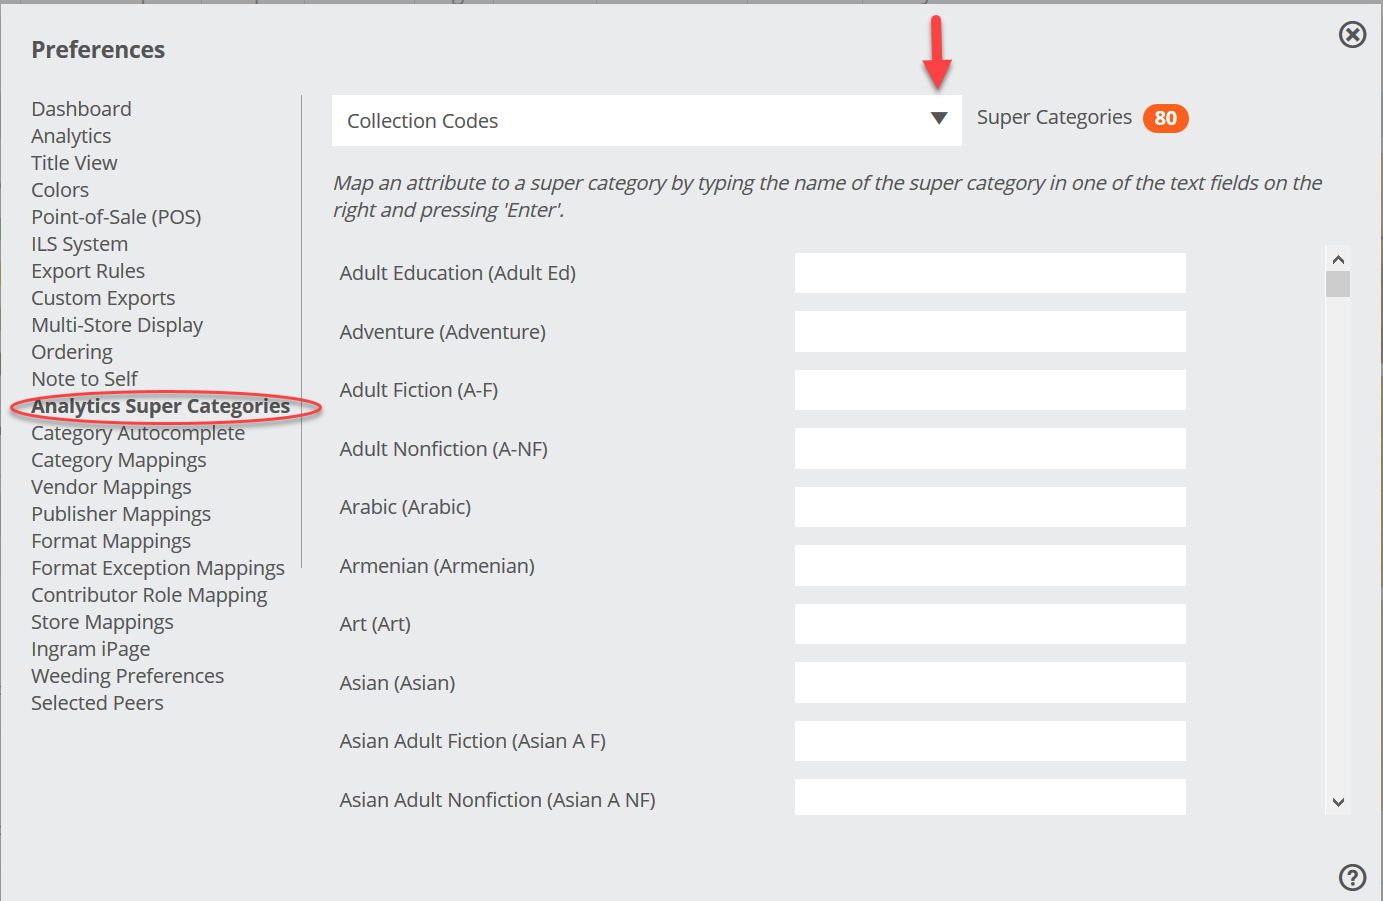
Click on the tools icon next to your name at the top of any Edelweiss page to see the Analytics Super Categories option on the left side of the dialog box. At the top, you can toggle between Collection Code (In this documentation, I am using the terms collection code to designate the shelf code used by a library. A Dewey number could be a considered a collection code. These are whatever custom ILS fields you sent us when we set you up on Analytics. This terminology may differ by library.):
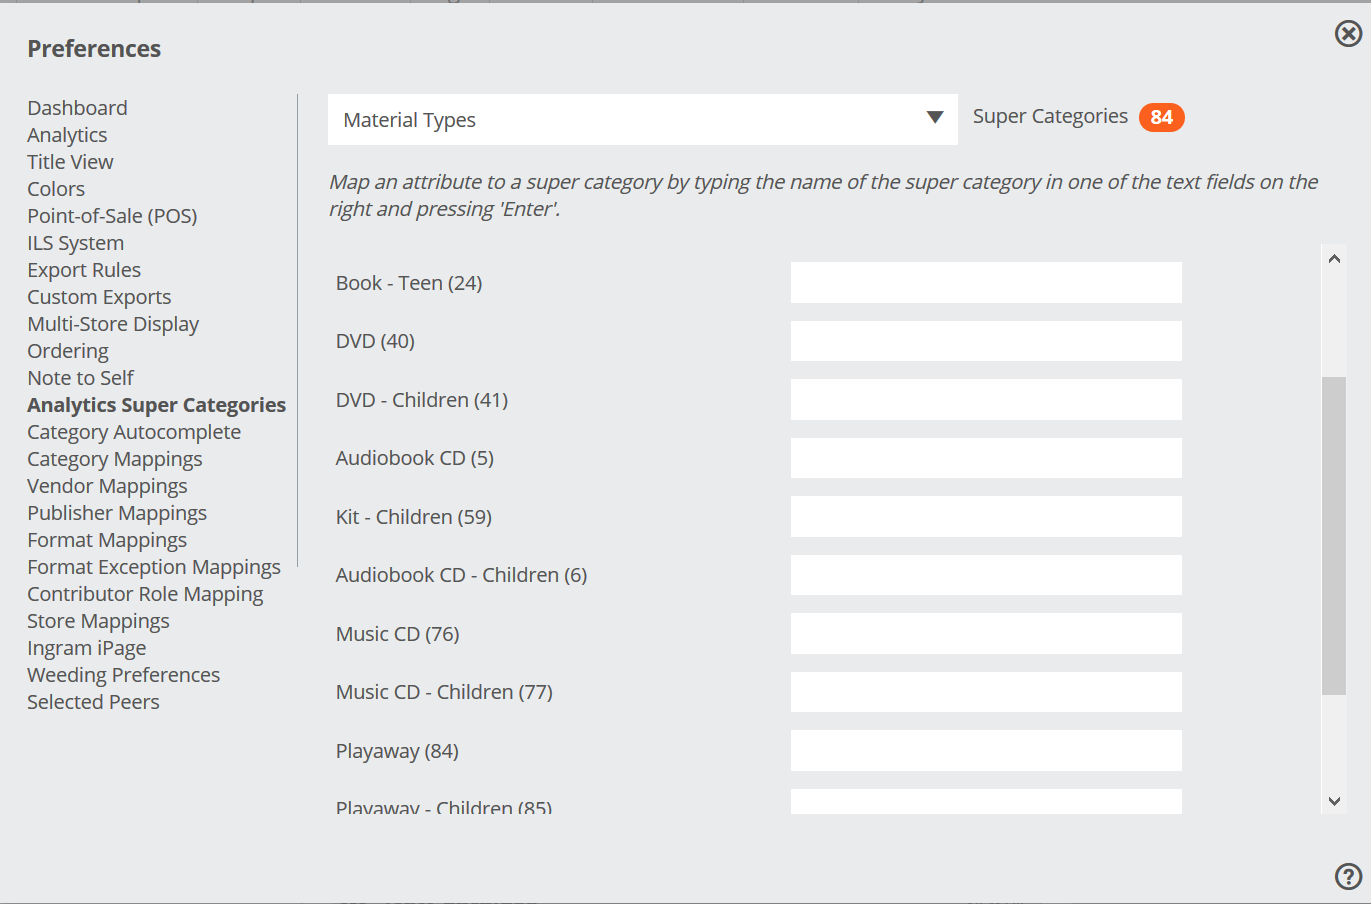
or Material Type:
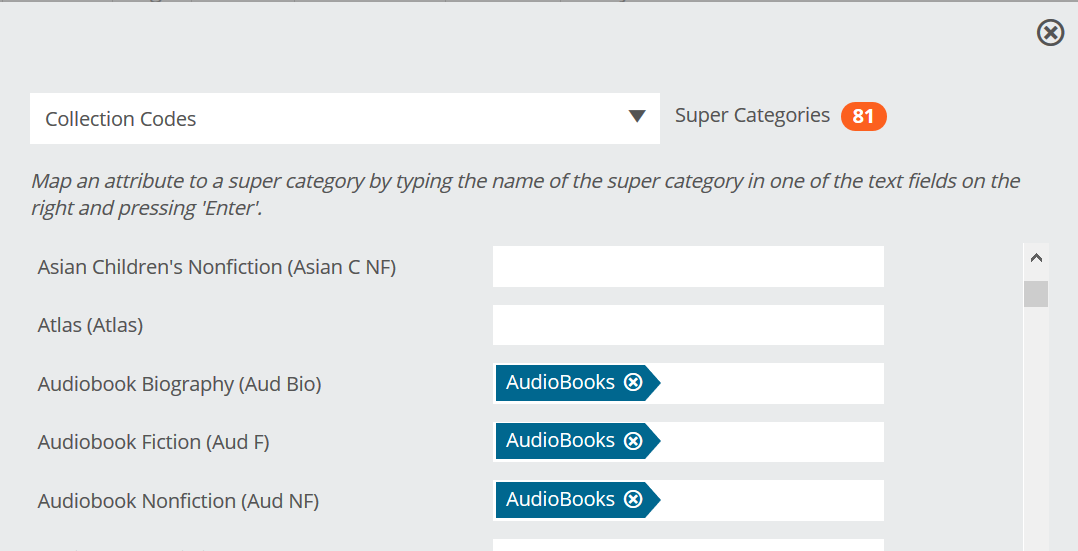
You can then group category codes into Super Categories by “tagging.” Just type in what you want and press <Enter>. You can add as many categories to a Super Category as you like. For example, if you have a number of titles that are AudioBooks and you have them further broken down by subject, you can create the Super Category just called AudioBooks as I have done here:
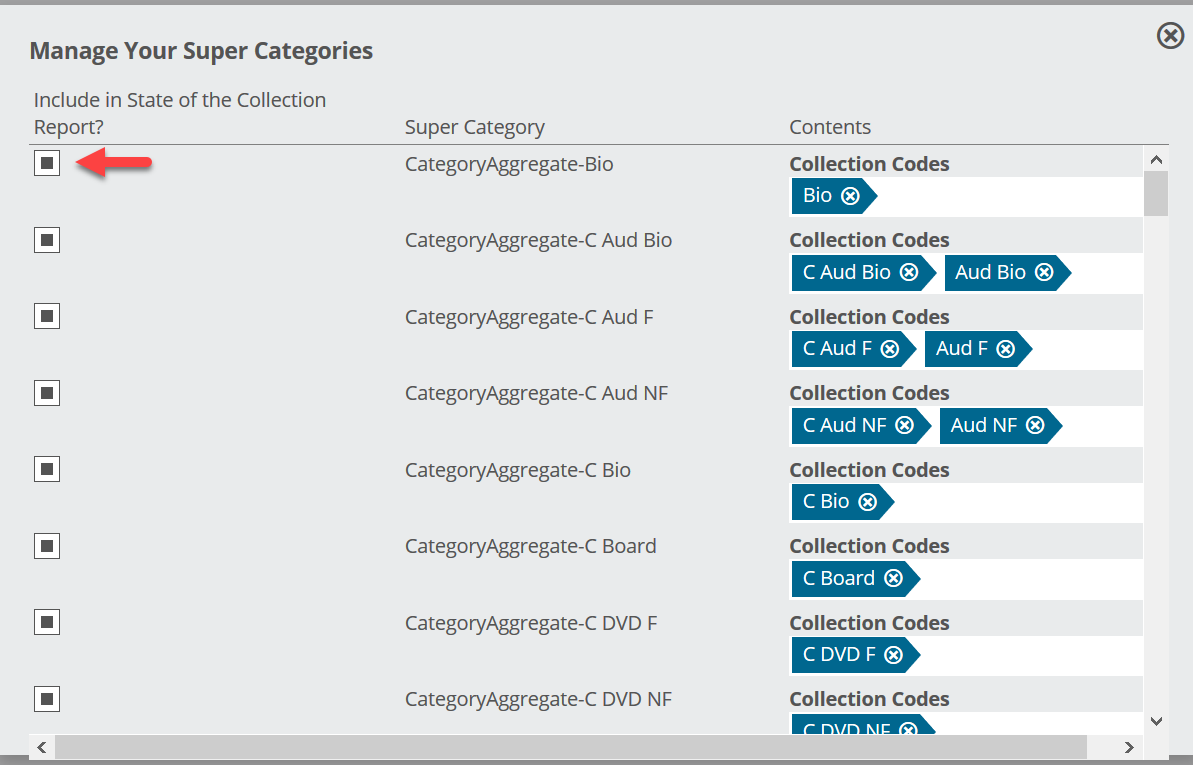
You can see how many Super Categories you’ve created at the top of the screen. Click in to that bubble to manage those Super Categories.
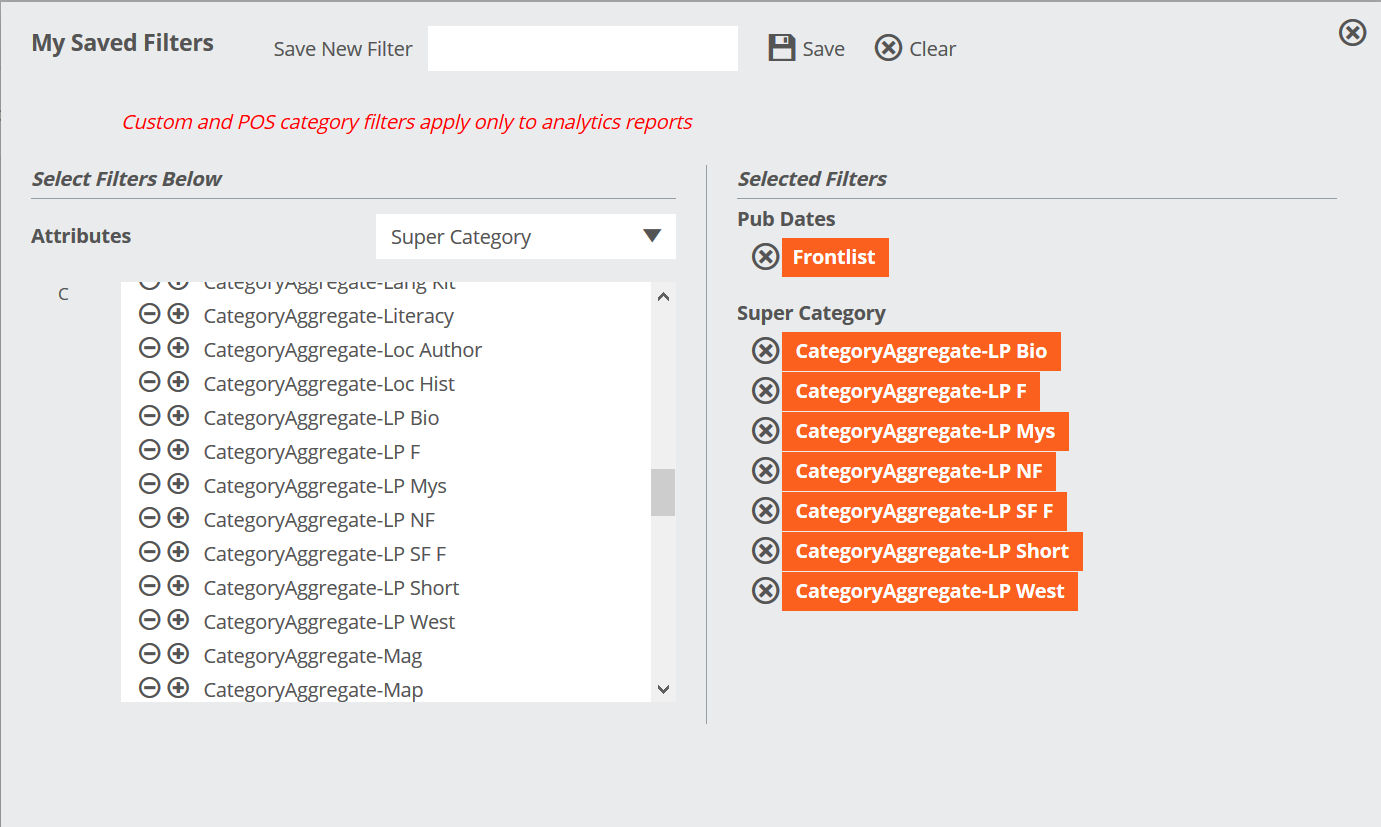
As you can see, you can select whether or not a Super Category is included in your State of the Collection Report with the checkboxes on the left. The “Contents” column will show you which of your categories are included in a Super Category. Click the X in the category name to remove that category from that specific Super Category.
In addition to using Super Categories in the State of the Collection Report, you can also use them as Saved Filters, which you can then use in your Analytics tools:
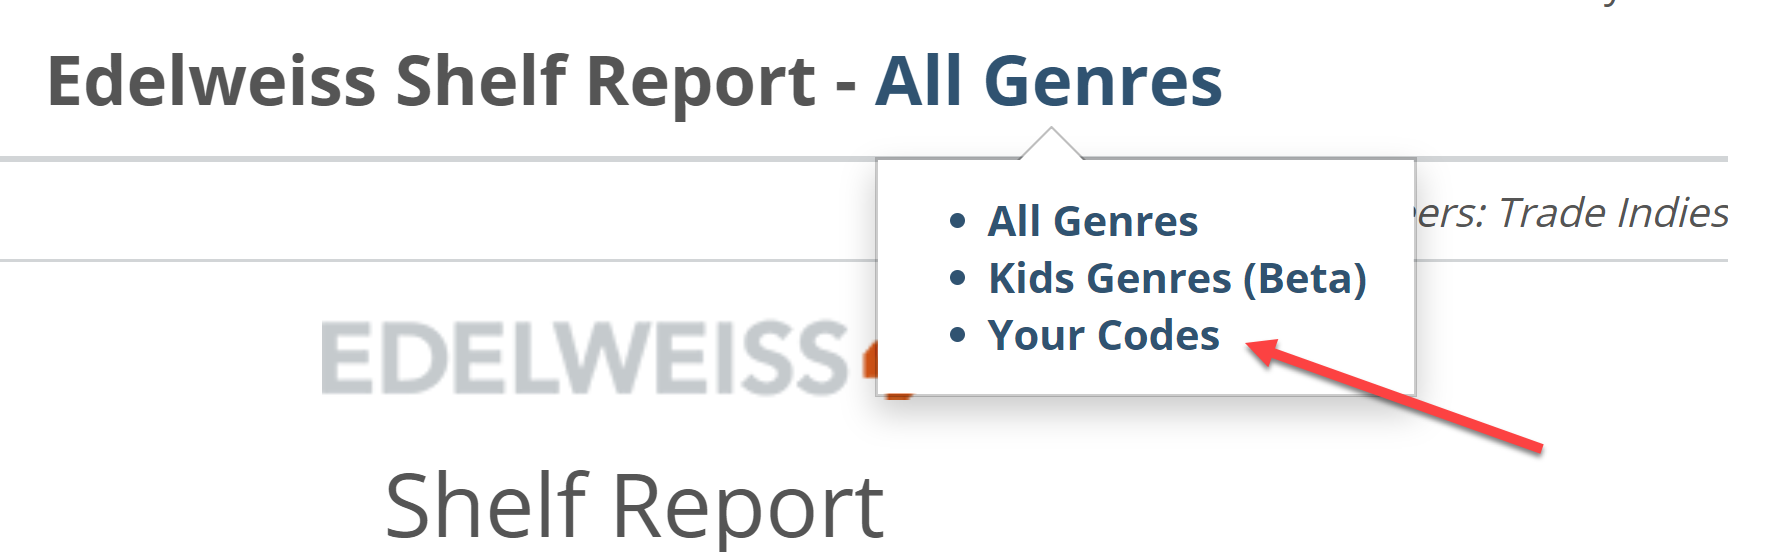
Your Super Categories will be available in your next Shelf Report. You can choose to view those Super Categories by clicking on “All Genres” at the top of any page of your Shelf Report:
State of the Collection Report Options and Settings
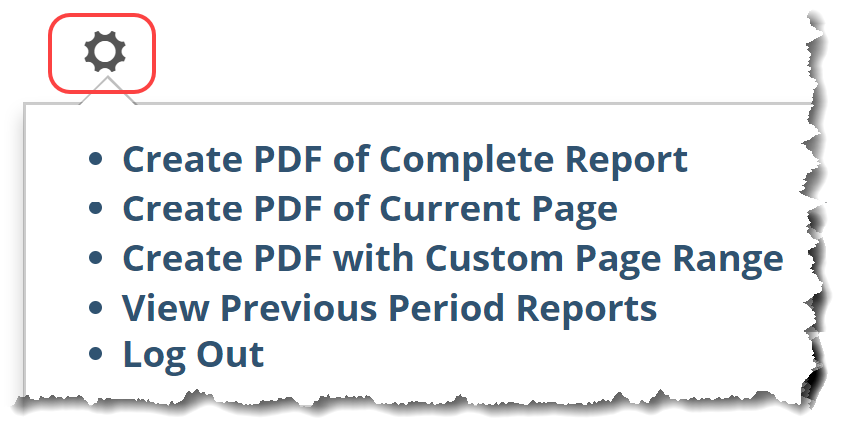
In the upper left corner of the State of the Collection Report, you’ll see a gear icon. This is where you can create PDF’s of this report, as well as view your previous reports:
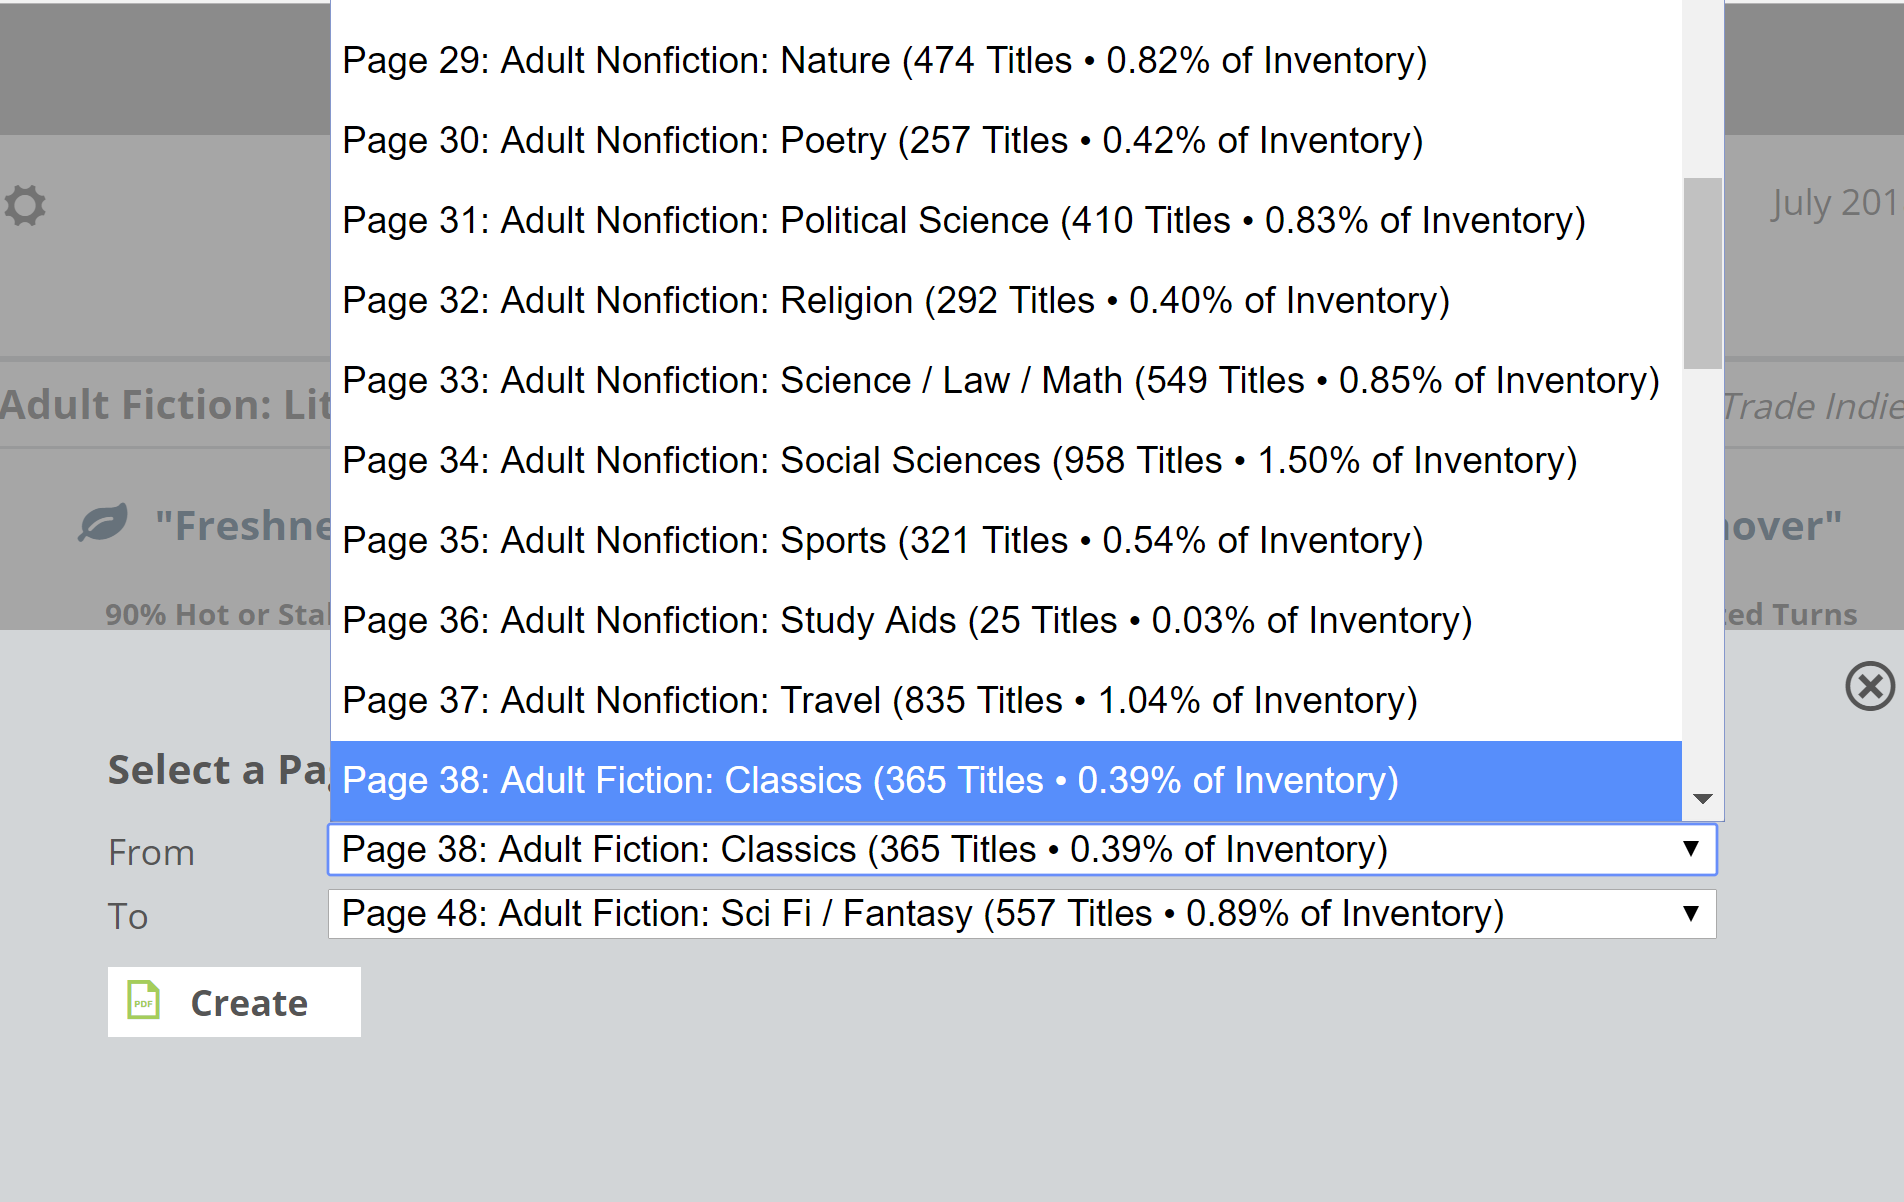
To create a pdf with a specific page range, you’ll need to simply select the start and end point for your desired document, with the page ranges matching what you see in your Jump To tool.
Edelweiss+ User Administrators can also decide who among the staff will receive the State of the Collection Report emails. This is done from Edelweiss+. Just click on your name at the top of any screen and select Account Users. User Admins can edit the privileges of any of their users, including adding the Emailed Report Recipient privilege: