
This tool is designed to show you the most popular titles in a market, how you’re “stocked” with those titles, as well as how those titles are performing in your library. You’ll be able to see which are the current best-circulating or best-selling titles. At that point, purchasing them or not is up to you, of course, but if you choose not to that will indeed by choice, and not because you simply missed them.
That brings up a point that we always try to emphasize: We consider Analytics to be a descriptive, rather than a prescriptive tool. We’ll show you what’s going on, but we don’t tell you what to do, so to speak. You know your patrons better than anyone, but making those decisions with as much information as possible can only be a helpful thing.
This tool gathers an aggregated list of titles in the market you’ve selected. You choose how many titles you want to see, as well as the time frame for the tool to use. If you’d like to see what’s “hot” right this minute, you can set a time frame of a month. If you’d like a longer view, you can looks at activity for the last 6 or 12 months.
The tool will take these parameters you’ve set, and portion the resulting list of titles according to your library’s own performance, based on the Shelf Days for each title. So you can see, for example, of the top 100 circulating titles across your market, what you own, what’s circulating well, and what’s not circulating. It can be interesting to see that a title might be doing incredibly well across the market but languishing in your library. This could be because it’s just not the sort of title that does well with your patrons, or it could be a very simple display issue, both of which can be quite illuminating. And which of the top titles do you not own? Is this because you don’t want to own them, or because you didn’t know they existed? If it’s because you’ve decided to not ‘stock’ them…this is an opportunity to reevaluate this decision.

Most Popular Titles- Setting Your Parameters
As with everywhere else in your Analytics tools, you can set a wide variety of filters to narrow down the list of titles you want to check out.
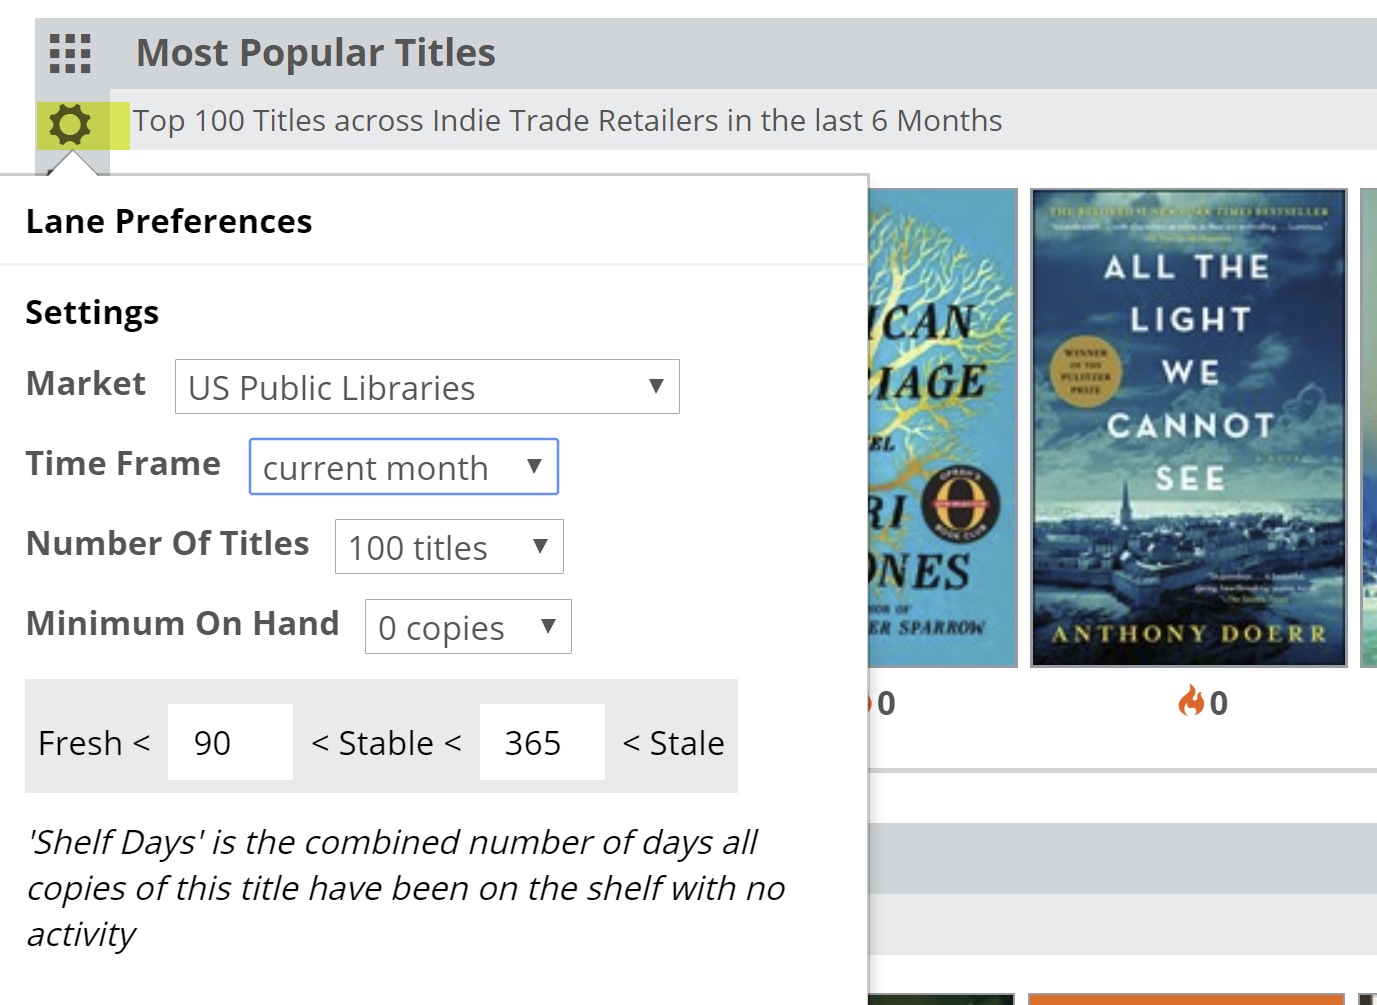
Click the gear icon on the right hand side of the lane to reveal a menu in which you can set a few parameters for this graph.
Here’s an explanation for each of your options:
Market:
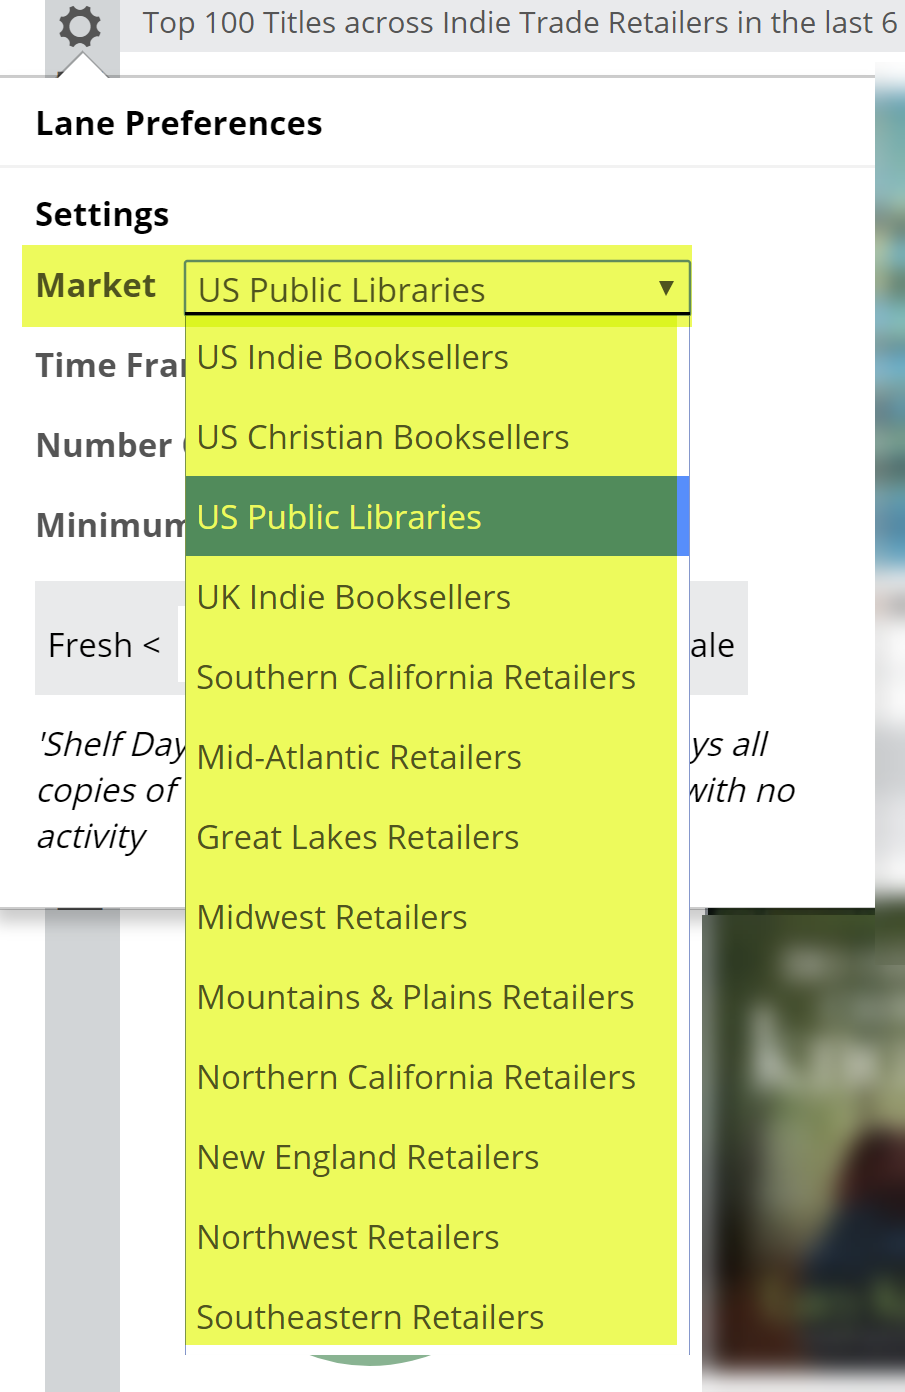
You can select to view results for your own market, or another market’s top-selling or top-circulating titles.
Time Frame:
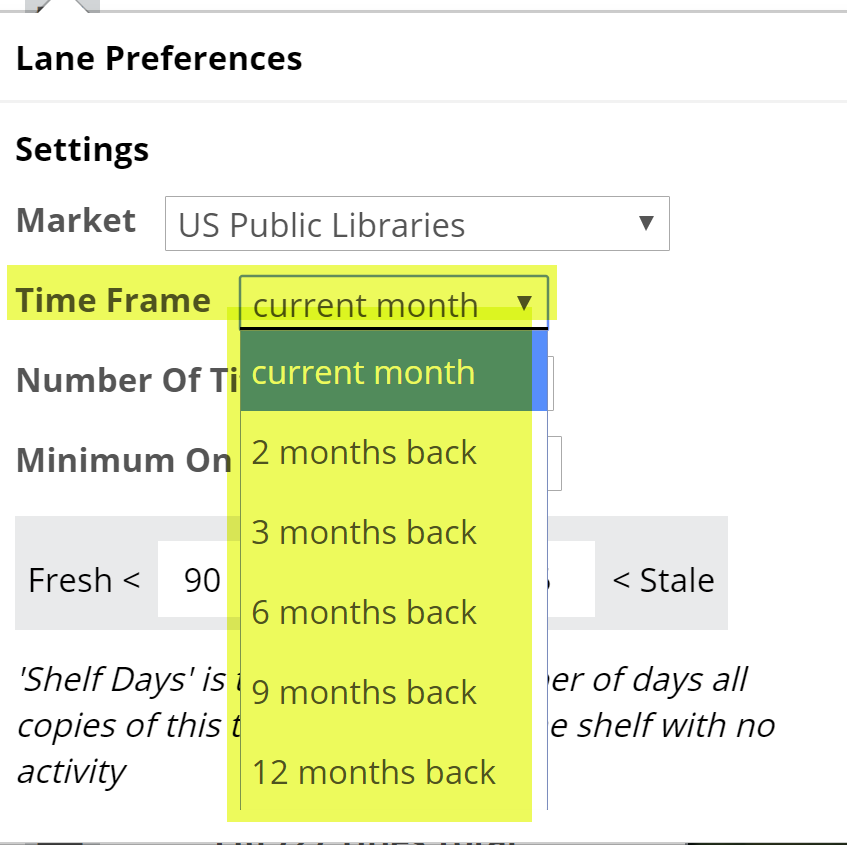
How far back would you like to look? Viewing results for 1 month back will essentially show you the titles that are hot and moving right now. Looking farther back, like a year, will show a longer tail, so to speak. Keep in mind that looking farther back will include other seasons, like the holidays, summer, etc. So if you’re using this graph to see if you’re missing any hot titles, a month or two of results make sense. If you’re looking to ‘beef up’ a section in your collection.
Number of Titles:
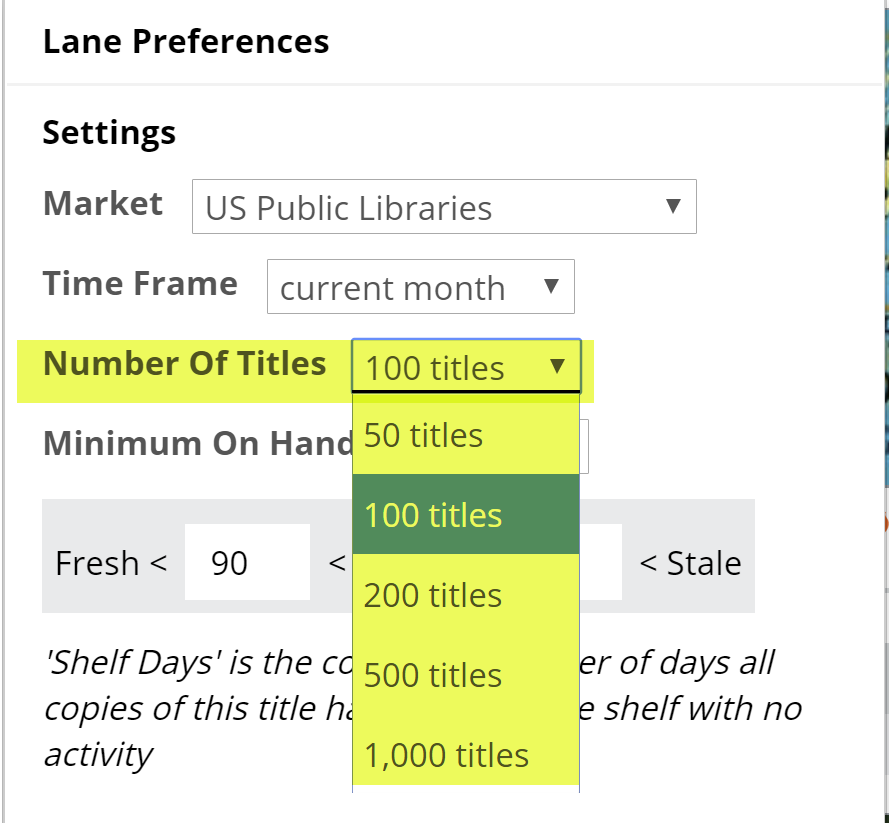
How much time do you have? What sort of project are you working on? How big is your library? Generally, with this graph you’re not necessarily going to sift through each and every title that comes up. For example, many users sort of ignore the titles that come up in the Fresh/Hot portion of the graph (the green) as they have those titles and they’re already doing well. People often look for titles they do not have on hand, or with which they’re not really doing very well…so pin-pointing possible gaps, really.
With that in mind, this shop can view the top 1000 titles and really just zero in on a few hundred that are either Not Owned or ‘stale.’

If you’ve set a filter for a specific, smaller portion of your collection, there’s likely no need to see the top 1000 titles. The top 100 might be more than sufficient for your needs.
Minimum On Hand:
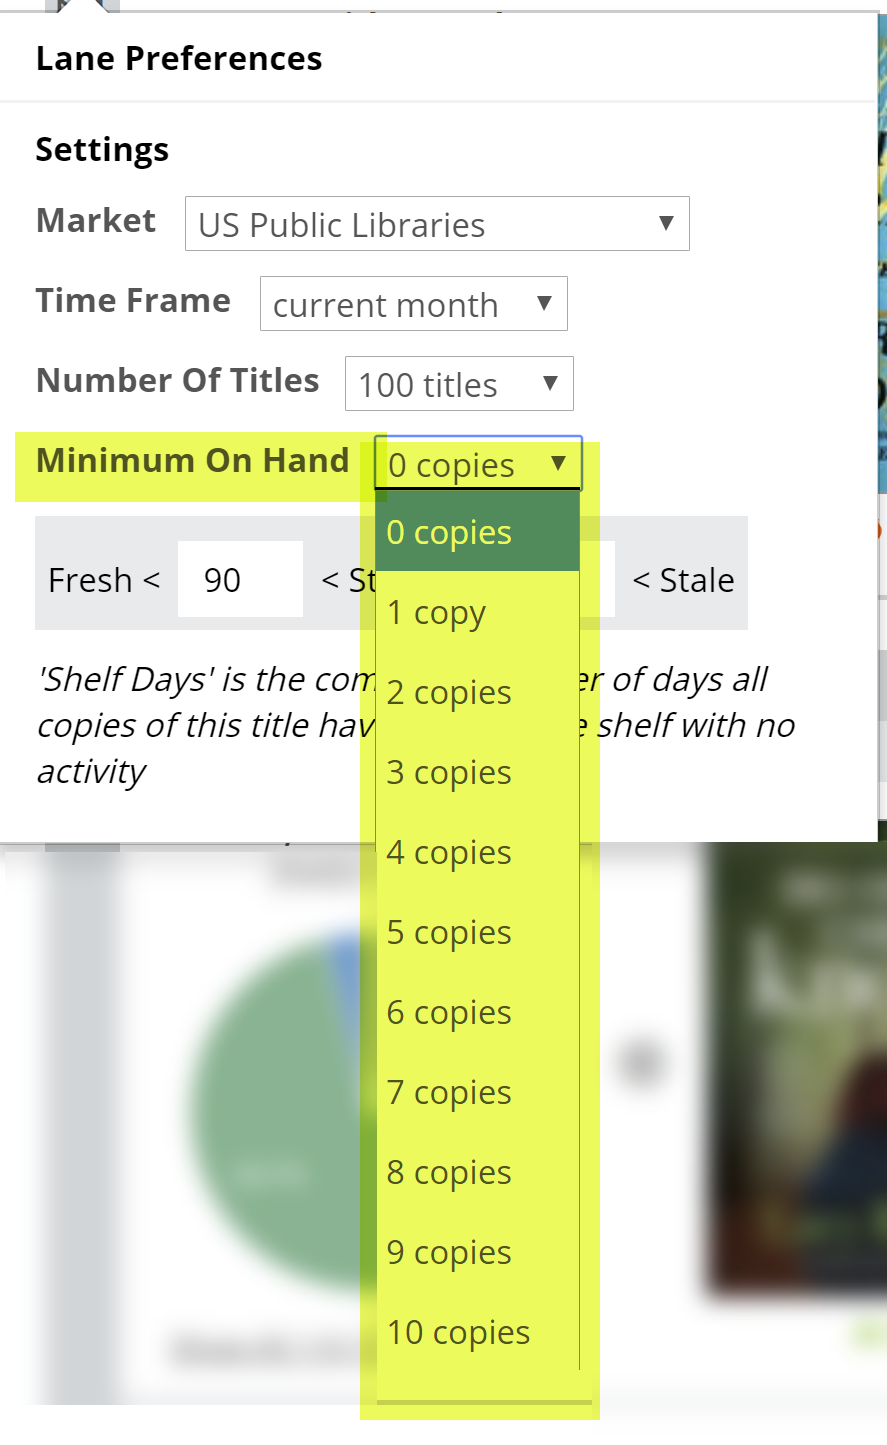
Set this to “0” to see all titles, including the titles you do not own. Setting it higher will filter out those titles you do not have on hand, which will essentially show just the titles you have on hand that are market-wide top-movers and how they’re performing for you. For example, setting the Minimum on Hand to “10” means that you’re only going to see the market’s most popular titles of which you have big stacks.

In the case above, most are doing great, but some are languishing a bit. Good information to know!
Shelf Days:
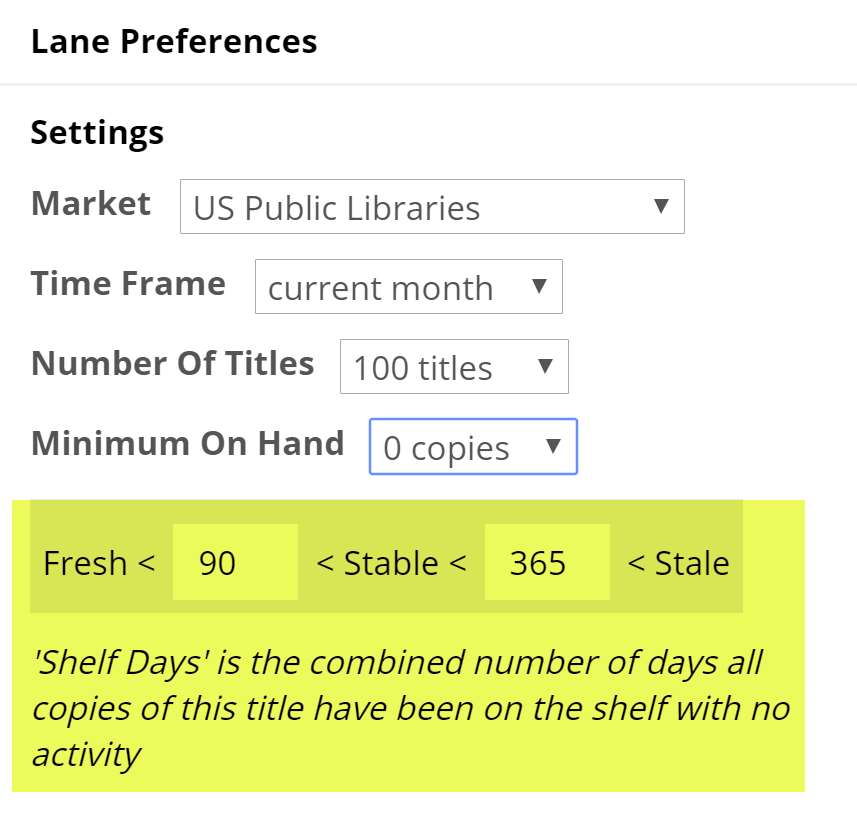
Shelf Days are fully explained here. This essentially allows you to set an upper and lower performance measure on your collection. So, how well, and how quickly, are your titles circulating?
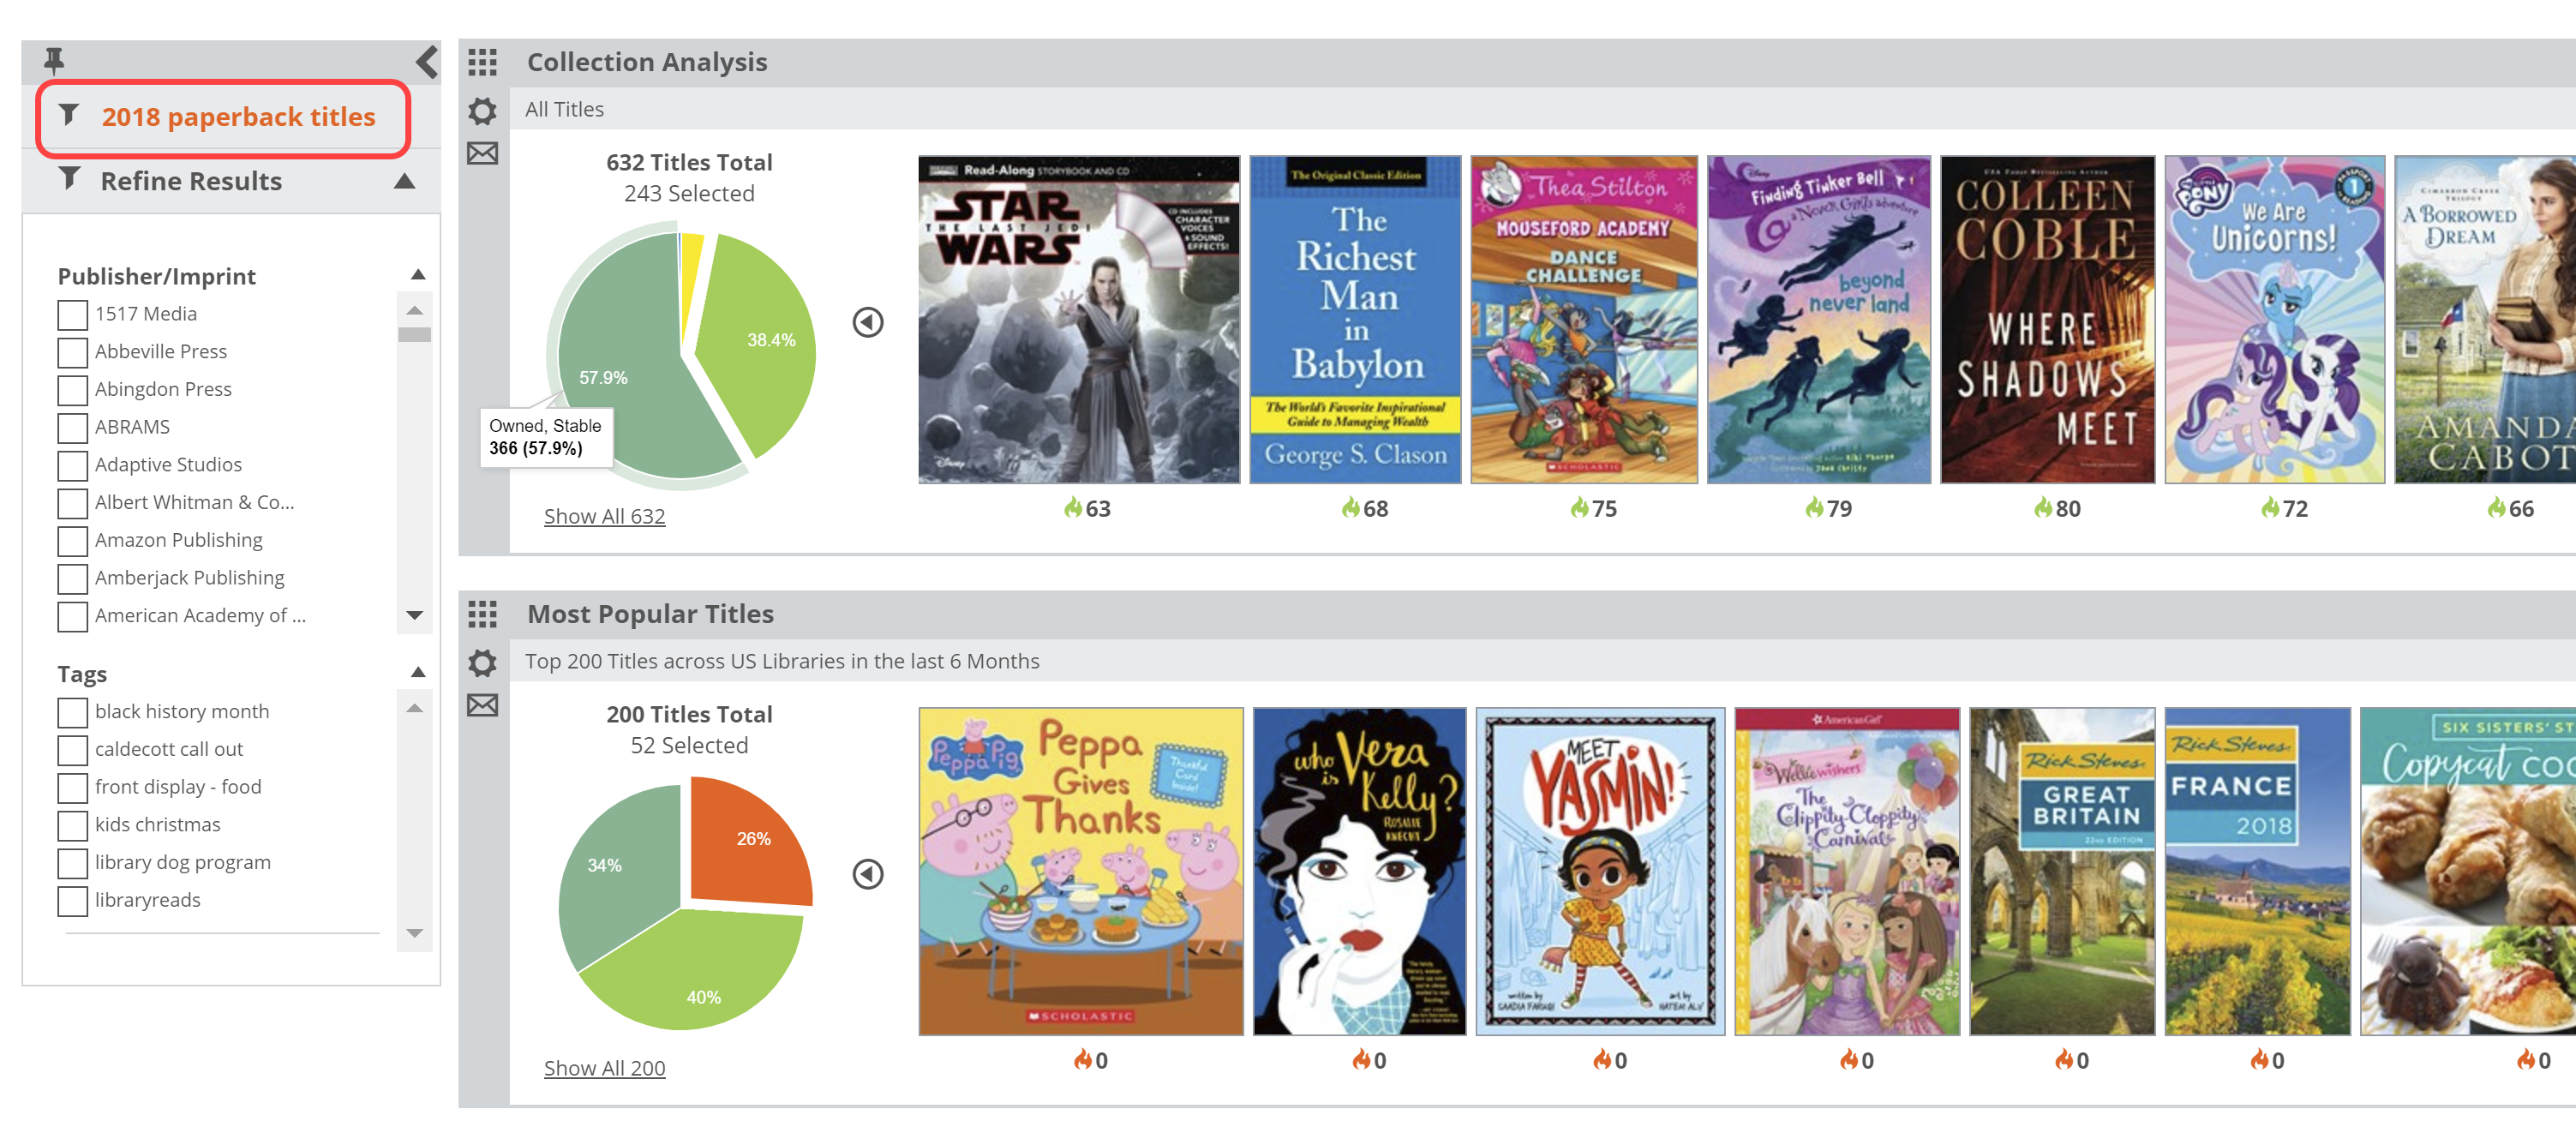
Most Popular Titles, Reading the Graph
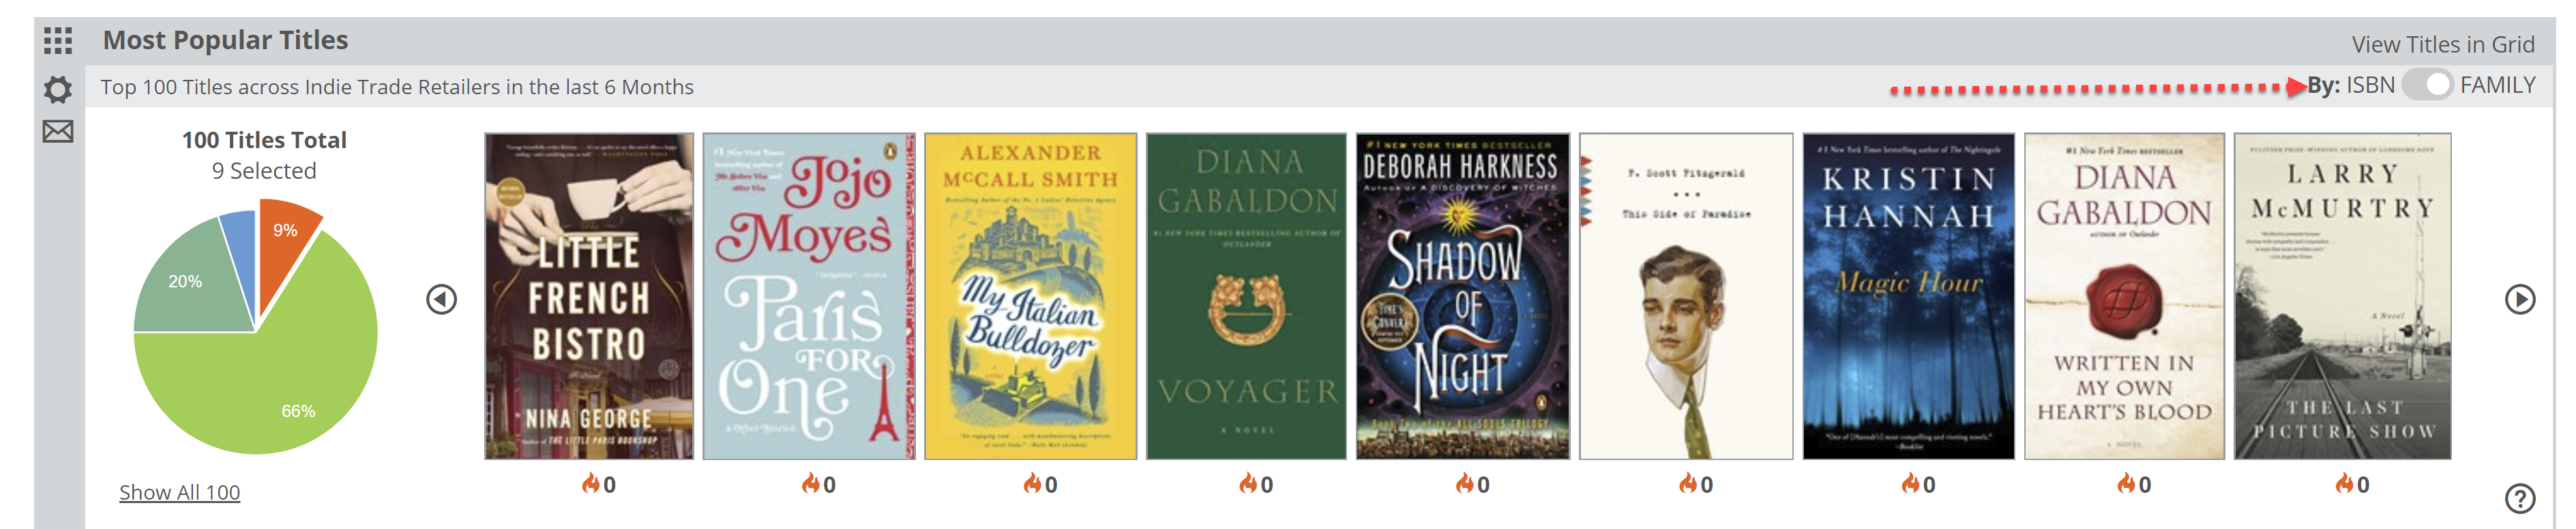
Once you’ve set the parameters you’d like to use for the Most Popular Titles lane (details here), you’ll see a pie graph along with a slider type view of the relevant cover images for the included titles.
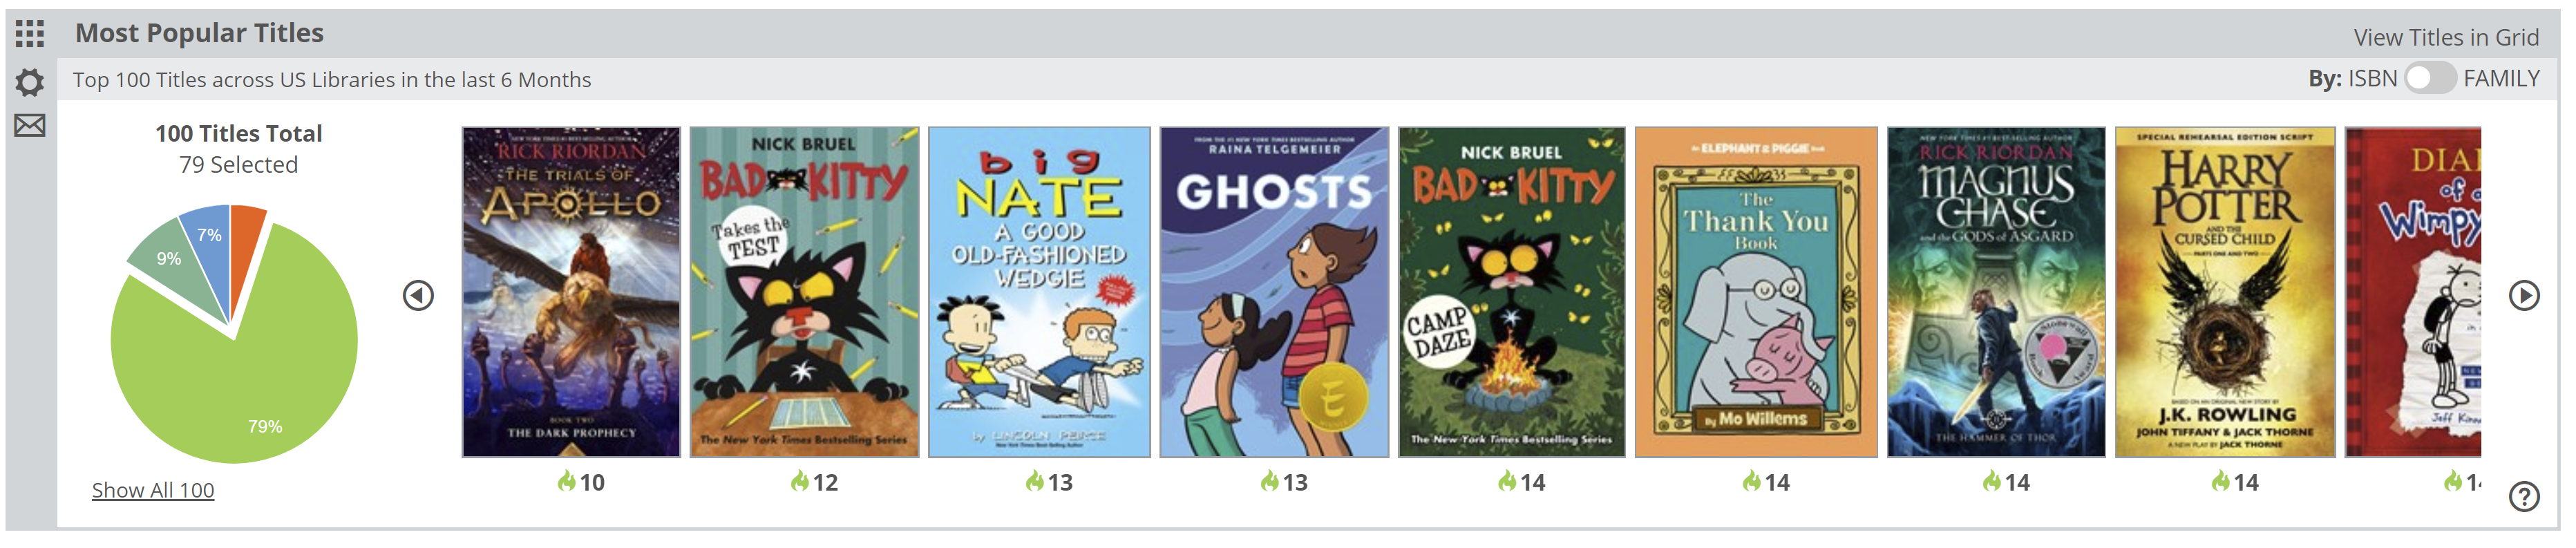
The pie graph portions out the titles according to your own library’s activity (see here to learn about Shelf Days).
You’ll see Fresh/Hot titles in the green slice.
The Yellow shows the Not Owned/On Order titles.
The red slice indicates titles that are Not Owned.
The bright blue slice indicates Owned, Stale/Cool titles.
The darker gray-blue area contains Owned/Stable titles.
Under each cover image, you’ll see a number with a color-coded ‘flame’ icon. (That color will correspond with the color-coded portion of the pie graph.) Hover your mouse over (or click) the flame to see details about this title–both your own activity and aggregated market data:

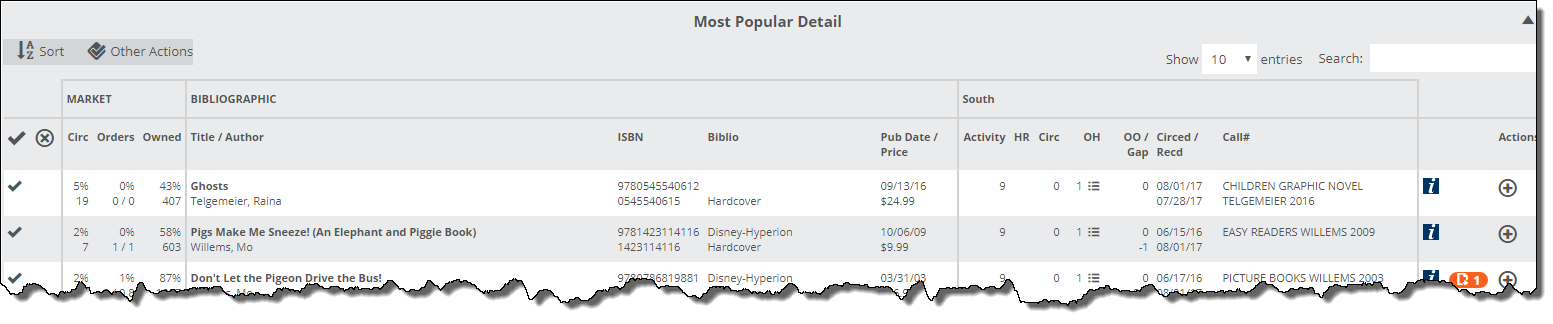
The 2 Shelf Days number indicates a low index number, which is good. In this case, 2 copies owned, with 1 copy circulated a day ago. This is an active/hot title.
The Peers line on the bottom here shows that this title has been sold/circulated by 57% of the other stores or libraries in the selected market (in the time frame you selected in the parameters). It’s currently on hand in 64% of all stores or libraries in this market, and 5% currently have this title on order.
The icons above the circled portion in the image above indicate standard Edelweiss functions, including Tags, Shelves, Reviews, Notes, Collections, and Export functions.
Click on the title or the yellow arrow to see a ton of additional information about this title:
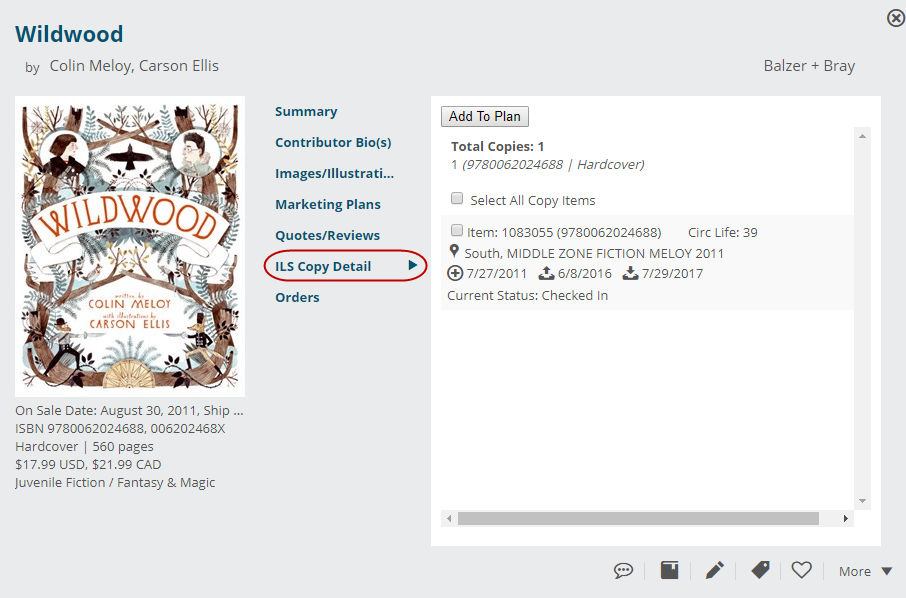
You’ll see all the publisher-provided bibliographic data, as well as peer shelves and reviews from the larger Edelweiss community. The ILS Copy Detail indicates even more of your library’s history with this particular title.
To see more information about the title listed in each area of the pie, click here:
Note that you can choose to Show All Titles if you want to see the whole list, rather than just a single portion of the pie.
The resulting Title Detail List has even more information. You can see details about that list of titles here.
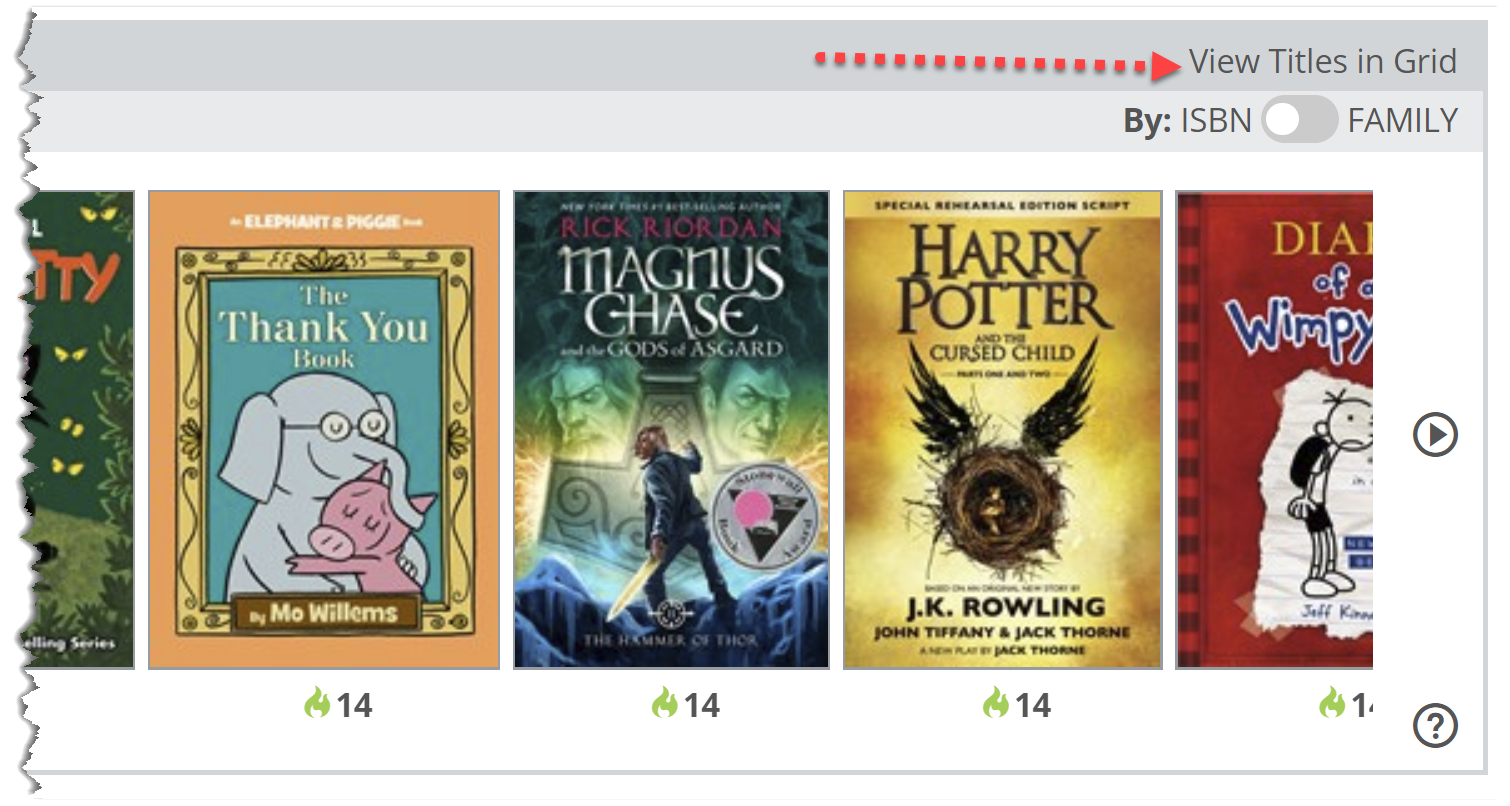
Family Display
You can choose between two different views in the Most Popular Titles and Not Yet Released Titles tools.
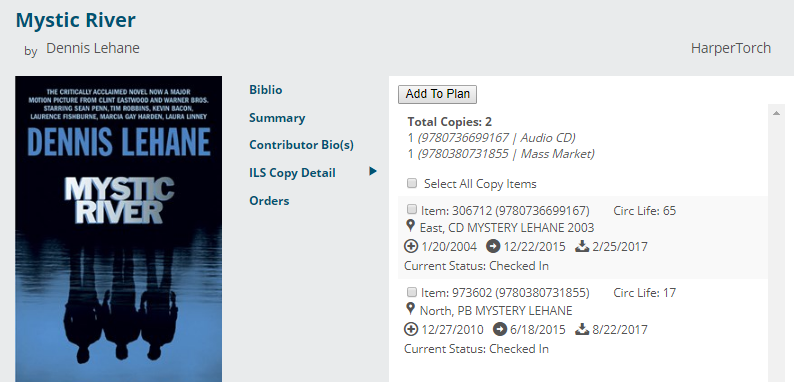
The By ISBN display will show the actual editions of each title that are selling or circulating the best. For example, if the paperback version of a recent title is selling the best in the retail market, that paperback version will populate this list. You may own the hardcover, but if you don’t own the bestselling paperback, the graph will indicate that you do not own that title. You can click in to the title to see if you do own other versions of a title:
The By ISBN view is a pretty black and white way to look at things, which some people very much appreciate.
There’s a very good chance, however, that you may not care, strictly speaking, which version you have, as long as you do have some version of the most popular titles. The By Family display view will actually measure the most popular titles according to all versions/editions. You can then, for example, click in to the red pie wedge, the Not Owned, and see titles that are moving well enough to be considered “Most Popular” of which you do not own in any version. The Title Detail screen will look a bit different, here, from the By ISBN view’s title detail list in that you will have the option to view all versions of the title in question, see how each moves in the market place, as well as your own holdings, if any.
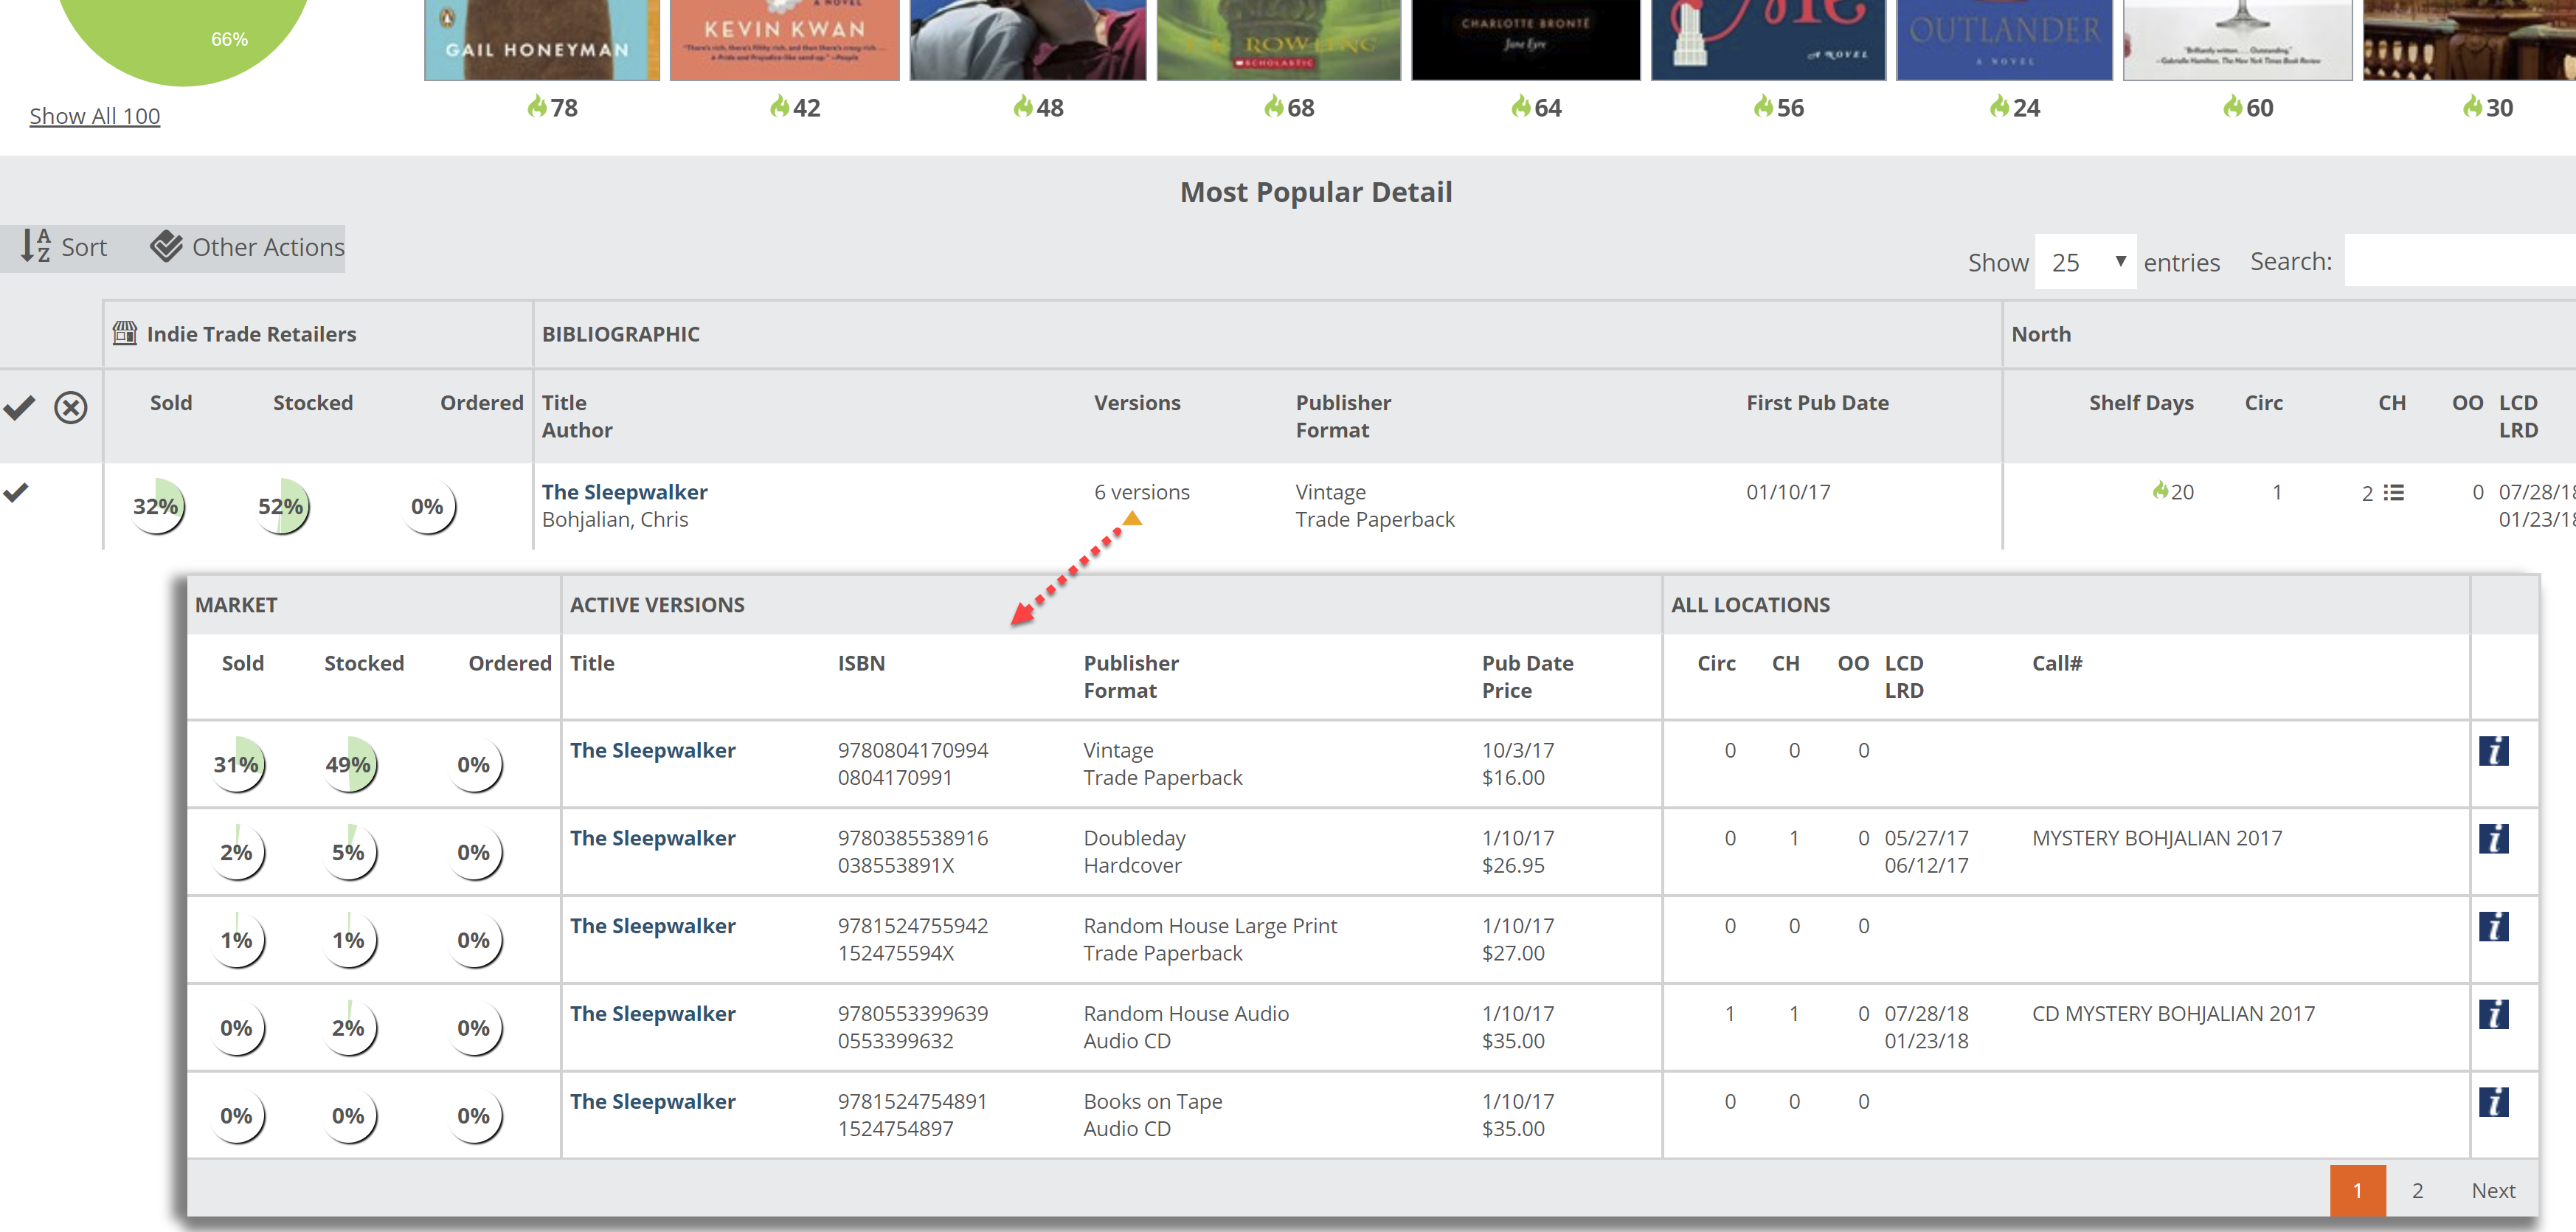
Note that by “Family,” we are referring to a group of products, each with their own ISBNs, that are judged to be equivalent representations of the same work.
When viewing a title’s detail screen, you can see this family data by clicking the dropdown arrow next to the title:
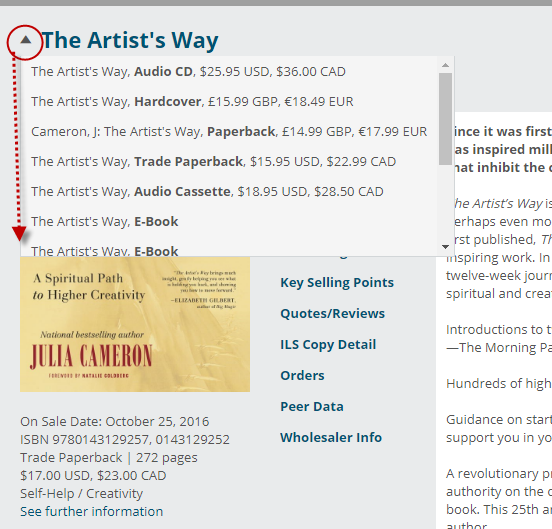
Click on a different format to view the title detail screen for that format.
If you come across a title that you do own, you may have uncovered a gap in the family mapping for that title. Note that titles with several different editions, some with different forwards by different writers, etc. may not be connected to that family for very good reasons. That said, if you come across something that is a clear discrepancy, you can let us know very easily!
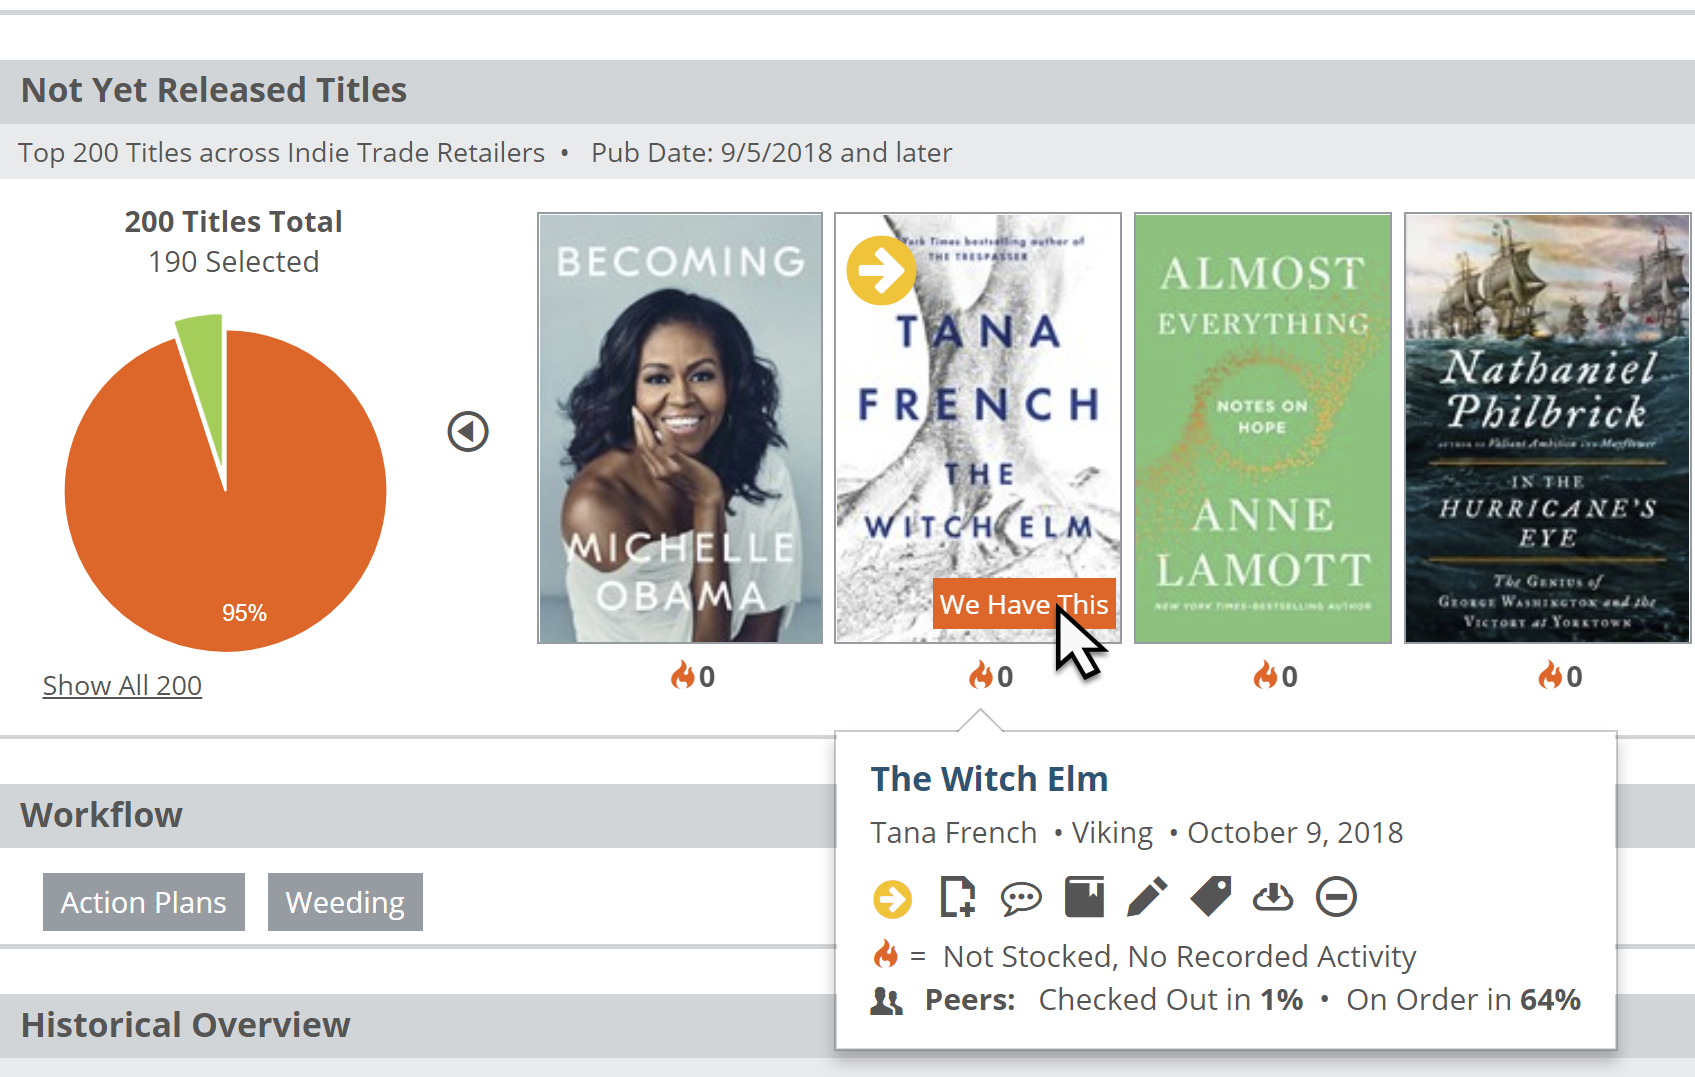
Hover your mouse over a cover image, and click We Have This and we’ll get an email and do the required research. Just clicking that button will improve the family mapping for you and all other users!